ISSN: 0970-938X (Print) | 0976-1683 (Electronic)
Biomedical Research
An International Journal of Medical Sciences
- Biomedical Research (2012) Volume 23, Issue 2
A new method for the measurement and analysis of three-dimensional morphological parameters of proximal Male femur
Linwei Lv1, Guangwei Meng1, He Gong1*, Dong Zhu2, Weimin Zhu1
1Department of Engineering Mechanics, Jilin University, Changchun, 130025, China
2Department of Orthopedic Surgery, No.1 Hospital of Jilin University, Changchun, 130021, China
- *Corresponding Author:
- He Gong
Department of Engineering Mechanics Nanling Campus
Jilin University Changchun
130025 P.R. China
Received date: September 28 2011
The common method to evaluate femoral fracture risk was to measure bone mineral density. However, the morphology of proximal femur also had a great influence on fracture risk. The objective of this paper was to measure three-dimensional morphological parameters of proximal femur more accurately. A new measurement method was established by reverse engineering technique. Fifty-one subjects with the age range of 66-75 were divided into two age groups. All subjects were scanned using QCT and the right femurs were reconstructed to perform the measurement. There were eight three-dimensional morphological parameters measured. Custom developed algorithm for parameters measurement was validated to be reliable. Relationships between these parameters were analyzed. Statistical results showed that there were strong correlations between the parameters. There were large differences in morphological parameters between different age groups. This study provides the basic data about the morphologies of proximal femur in elderly male and the references for the fracture risk evaluation of proximal femur for elderly.
Key words
Three-dimensional; Morphological parameters; Proximal femur; Measurement
Introduction
Osteoporosis is a kind of disease characterized by reduced bone mineral density (BMD), deteriorated bone microstructure and increased bone fragility. The sites most susceptible to osteoporosis are those full of cancellous bones, such as proximal femur, thoracic and lumbar vertebral bodies. Osteoporosis can reduce the mechanical properties of bone, and the most serious consequence is fracture [1].
The proximal femur is composed by three parts of femoral head, femoral neck and femoral shaft. The majority of femoral head and femoral neck consist of cancellous bones, which are prone to osteoporosis. In the natural standing state, proximal femurs bear full weight of the upper body. Proximal femurs are susceptible to fracture for the elderly with severe osteoporosis.
With the increase of age, bone mass of healthy males declined sharply. There were also high fracture risk existed in aging men [2]. Mazess noted that from the age of 70, bone mass in femoral neck and greater trochanter declined sharply. It was found that age and weight might have impact on fracture risk and fracture type [3, 4].
Low BMD is one of the most important indicators of fractures [5]. However, fracture risk cannot be solely evaluated from BMD. There are also some patients with high fracture risk but normal BMD. The morphology of proximal femur is also an important indicator of proximal femur fracture [1, 6, 7, 8, 9, 10].
Previous studies of proximal femoral morphology were about the relationship between hip axis length (HAL) and hip fracture risk. However, no consensus was achieved. On the one hand, some researchers found that there was a strong correlation between HAL and fracture risk [7, 8, 11, 12]; but on the other hand, there were also some investigations that did not find such a correlation [13, 14, 15]. The studies mentioned above were mostly based on the two-dimensional Dual-energy X-Ray absorptiometry (DXA) images. As a matter of fact, planar image was only a projection of the object, which could not reflect the complex three-dimensional morphology of femur. Since the positions of the subjects may not uniform during the X-Ray scanning, large individual differences may occur from those images obtained. This may lead to a nonunified measurement [16].
The process of scanning usually brings in errors. The most accurate measurement is to measure the skeleton directly. This method can only be used to the threedimensional morphological parameters in vitro, but not in vivo. The operating habits of the operators would also have a great impact on results, so this measurement requires professional staff to complete the experiment and is not suitable for measuring a large number of in vivo samples.
Another method of morphological parameters measurement is to measure the parameters on three-dimensional proximal models that were reconstructed from clinic QCT images by reverse engineering technique. As X-ray planar imaging technology will zoom the object, there may be a large error existed in the morphological parameters when considering the measurement accuracy. This error is about 12% of general X-ray machine [17] and about 7% of DXA [18, 19], but with no errors in QCT. A previous investigation regarding cadaveric femurs was performed to measure the morphological parameters on X-ray images, CT images, as well as on the skeleton directly. The results showed that there was 2.4 mm error occurred on X-ray images and only 0.9 mm error on CT images. There was few literature on the comparison between computer aided measurement and manual measurement for one sample in vivo. So the differences between these two methods cannot be evaluated.
Accordingly, in this study, three-dimensional femur models were reconstructed from clinical QCT images by reverse engineering method. The measurements on the reconstructed models were accomplished entirely by computer aided method. All calculations were compiled into a program. Therefore, three-dimensional morphological parameters could be calculated conveniently through the feature points coordinates snapped by cursor. Eight representative three-dimensional morphological parameters of proximal femur were measured on the reconstructed models. We combined three-dimensional morphological parameters with age, weight, height and BMD to perform a series of statistical analysis to find their correlations. This study may provide the basic data about the morphologies of proximal femur in elderly male and the references for the fracture risk evaluation of proximal femur for elderly.
Materials and Methods
Subjects
In this study, Fifty-one healthy Chinese males with no history of femoral disease or hip disease were selected as subjects. The range of age was 66-75, and the average age was 70.5 years old. All samples were divided into two age groups to observe the morphological differences in the femur. Group A was the subjects with 66-70 years old and the average age was 68; group B was the subjects with 71-75 years old and the average age was 73. Height, weight and BMD of all subjects were recorded as parts of morphological parameters of proximal femur. Written informed consents were obtained from all the subjects.
Computed Tomography Scanning
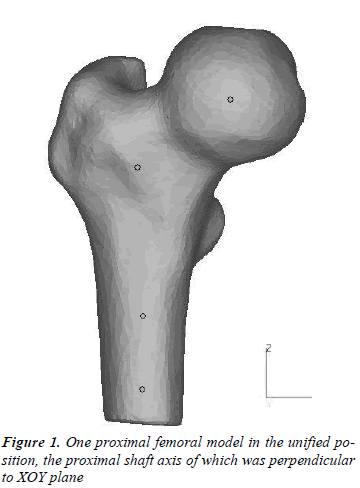
All subjects were scanned using clinic QCT (GE Medical Systems/LightSpeed 16). Since the radiation dose on subject should be strictly controlled, the scanning area was the part from upper edge of the acetabulum to 50mm below the less trochanter. QCT scan acquisition was performed with 80kv, 260mAs, 512×512 matrix, 0.938 mm pixel size and 2.5mm increment. All QCT data were imported into reverse engineering software MIMICS 10.01 (Materialize Inc.). All right femurs were used to do 3D reconstructions. After a series of operations, i.e., creating masks, region growing, 3D objects calculation and remeshing, models of right femurs were established. The subjects may not hold on a unified position during the process of scanning, in order to set a uniform measurement standard, all models need to be rotated and translated to a specified position according to the coordinate system generated by CT machine. Each model reconstructed by MIMICS was rotated around the X-axis and Y-axis respectively in MAGICS 13 (Materialize Inc.) to ensure that the shaft axis was perpendicular to XOY plane. As the shaft axis was fixed and morphological parameters were measured on three-dimensional models directly, anteversion did not affect the parameters measurement much [20]. The femoral model in the unified position was shown in Figure 1.
Measurements of morphological parameters of proximal femur
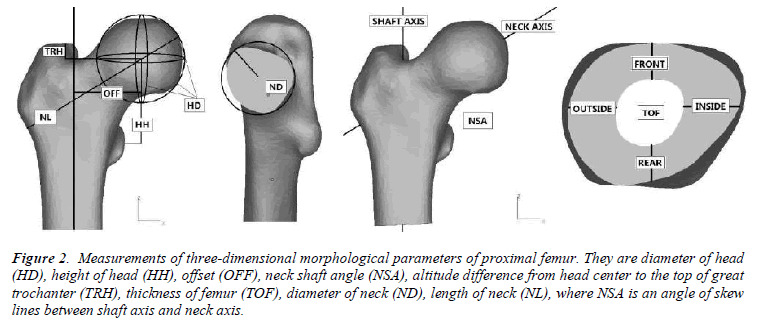
Morphological parameters of the proximal femurs were measured in MAGICS. Eight three-dimensional morphological parameters of proximal femur were measured, which were shown in Figure 2. Two auxiliary lines need to be created during the measurement process, which were shaft axis of proximal femur and neck axis. Shaft axis of proximal femur: shaft of femurs in most old people were curved, but shaft axis of proximal femurs almost keep straight. So the lower edge of lesser trochanter and 25 mm below the lower edge of lesser trochanter were cut off, and the contours of cross-sections were fitted with circles. The connection of two circle centers was defined as shaft axis of proximal femur. Neck axis: we cut off the narrow end of femoral neck and fit the cross-section with a circle. The connection of circle center and head center was defined as neck axis. Generally, there were three types of neck cross-section: circle, ellipse and triangle. The fitting circle was defined as the contour of crosssection to the circle, short axis of the ellipse as diameter of fitting circle and circumcircle of triangle.
Figure 2: Measurements of three-dimensional morphological parameters of proximal femur. They are diameter of head
(HD), height of head (HH), offset (OFF), neck shaft angle (NSA), altitude difference from head center to the top of great
trochanter (TRH), thickness of femur (TOF), diameter of neck (ND), length of neck (NL), where NSA is an angle of skew
lines between shaft axis and neck axis.
The parameters were defined as follows [21]: HD: diameter of femoral head. Fit the contour of the femoral head with a circle at front view, top view and right view, respectively. The mean of the diameters of the fitting circles is defined as diameter of head. The mean of the center coordinates are defined as HC.
HH: height of femoral head. Altitude difference from HC to the top of lesser trochanter.
OFF: offset. Distance from HC to shaft axis.
NSA: neck shaft angle. Skew lines angle between neck axis and shaft axis.
TRH: altitude difference from HC to the top of greater trochanter
TOF: thickness of femur. Thickness of the femur 25 mm below the lower edge of the lesser trochanter, i.e., the average thickness of femoral shaft in the front, rear, inside and lateral sides.
ND: neck diameter. Fit the contour of the narrow end of neck cross-section with a circle. The diameter of the circle is defined as ND.
NL: length of neck. Distance between the two intersections points of neck axis and femur contour.
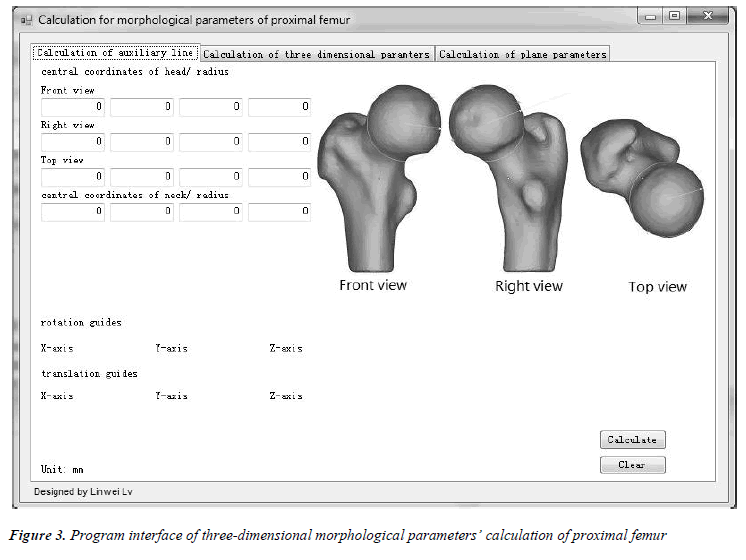
HD and TOF could be calculated by snapping node coordinates of femoral surface, but other parameters could not be calculated directly. The models should be cut off, and then the node coordinates inside the model could be snapped to measure these parameters. Therefore, a selfdeveloped program was made to integrate the process of parameters' calculation in Visual Studio 2008, which can calculate the three-dimensional parameters of proximal femur automatically. The program interface was shown in Figure 3.
Verification about the measurement method
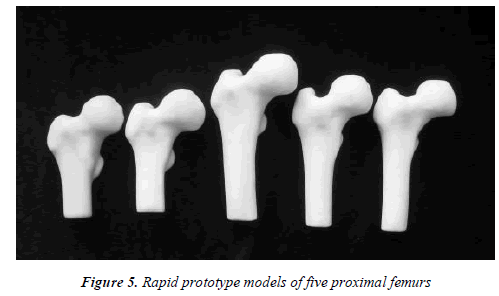
Five samples were selected randomly from the fifty-one samples to perform rapid prototype (RP) modeling, which were shown in Figure 4. Three-dimensional morphological parameters were measured manually on the RP models with micrometer and protractor. Paired T test was performed between manual measurement and computer aided measurement to validate our method.
``
Statistical analysis
All parameters measured and age, height, weight, BMD were imported into statistical software SPSS 16.0 to perform statistical analysis. The mean value and the standard deviation were calculated for each parameter. Bivariate correlations analysis was performed between each two parameters. Independent-samples T test were performed for each parameter between group A and group B to observe the differences of morphology between different age groups.
Comparison with traditional 2D measurement method
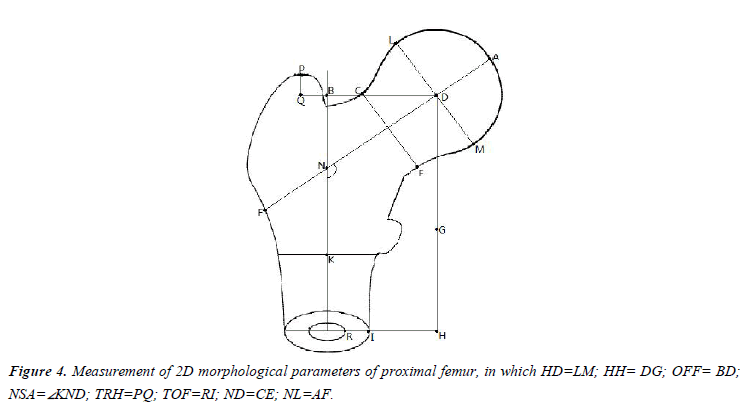
In order to compare the difference with 2D measurement method, we also simulated a 2D environment in MAGICS and measured the 2D morphological parameters of each proximal femur. The definition of 2D morphological parameters of proximal femur was shown in Figure 5 [9]. Paired T test was performed for all eight parameters between two measurement methods, so we could find out whether there were differences existed between two methods.
Results
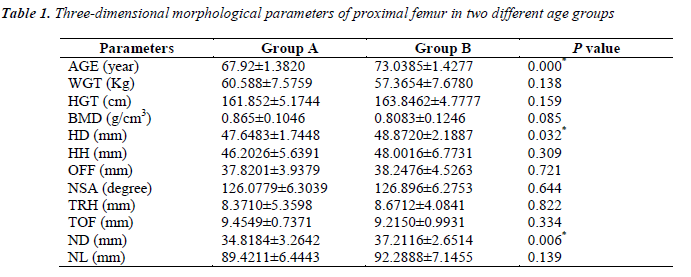
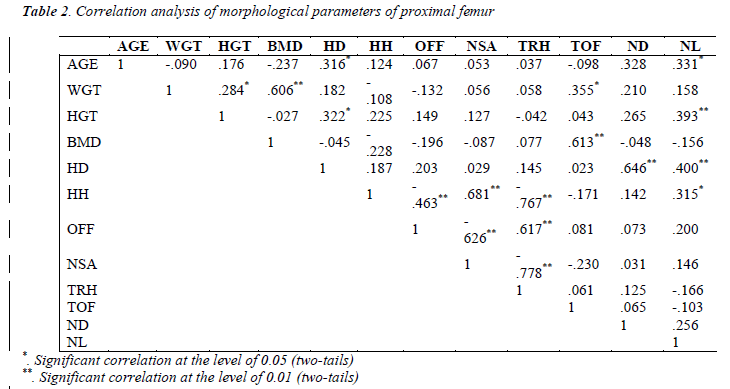
The three-dimensional morphological parameters of proximal femurs were shown in Table 1. There were significant differences in parameters HD and ND between the two age groups. Bivariate correlations test were performed for all the parameters. The result was shown in Table 2. There were significant correlations between morphological parameters. It was found that AGE correlated with HD, ND and NL, WGT correlated with HGT, TOF and BMD. BMD only significantly correlated with WGT and TOF, respectively. And the most relevant parameters were NSA and TRH. TOF didn’t correlate with any other morphological parameter.
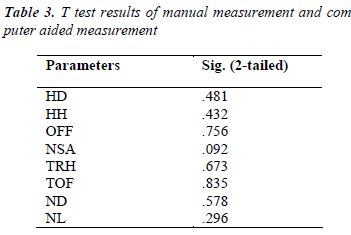
Paired T test was performed for manual measurement on RP models and computer aided measurement. Table 3 shows that the p value in the comparison of each parameter was larger than 0.05, which means that there were no significant difference between the two measurements. Manual measurement could be replaced by computer aided measurement we developed in this paper.
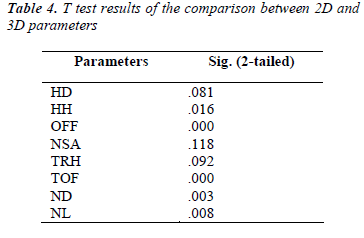
In order to compare the differences between 2D parameters and 3D parameters, paired T test was performed for the two measurements, which was shown in Table 4. There were significant differences under the two measurements for parameters HH, OFF, TOF, ND and NL.
Discussion
With the help of medical imaging technology, in this paper, an algorithm for measuring three-dimensional morphological parameters of proximal femur has been developed. In our pilot study, we have taken a measurement of 20 samples [22]. Correlation tests were performed between every two parameters and differences tests were performed between two age groups. Only non-parametric tests could be performed duo to small sample size. In this study, in order to further verify the algorithm, we also measured the same morphological parameters directly on rapid prototyping models by micrometer and protractor. The paired T test proved that the computer aided method we developed was reliable. The algorithm of morphological parameters of proximal femur designed by Dong and Zheng fitted femoral head into sphere, fitted femoral neck into round table and fitted shaft of femur into cylinder [23]. However, fitted proximal femur may miss a lot of morphological information. In the algorithm designed by us, in order to describe the morphology of femurs more feature points coordinates’ information were snapped. The cross-sectional shapes of different femoral necks were quite different, so for the different femoral necks, repeated measurements were taken to find the narrow end of femoral necks.
Chantarapanich et al. [24] measured femoral curvature and femoral length of proximal femur which were reconstructed from CT images. Song et al. [25] fitted the femoral head and part of acetabulum of reconstructed model with a sphere, and measured the center coordinates and radius of fitting sphere. However, they did not measure other parameters of proximal femur but these two parameters, and they did not verify the measurement method either. Kaneuji et al. [26] measured the anteversion of reconstructed models at coronal plane and sagittal plane separately. This method was still a measurement of 2D parameters. Aroonjarattham et al. [27] and Rubin et al. [28] measured the parameters on cadavers, which cannot apply to the in vivo measurement. For our method, however, not only the high accuracy as the measurement on cadavers could be reached, but also we can obtain the precise 3D morphology of femurs.
From the result of paired T test between manual measurement and computer-aided measurement, it was found that there was no significant difference between the two measurements. This meant that computer-aided measurement using the custom algorithm was reliable for measuring three-dimensional parameters of proximal femur. It was also possible to measure large number of in vivo samples with this method. From Table 3, it was found that although the error between the 5 models reconstructed from QCT images and skeleton was negligible, there were still differences existed in the process of measurement between manual measurement and computer-aided measurement. They mainly came from the modeling process and measurement process:
1. The process of model reconstructions using reverse engineering technique. The threshold of mask and remesh might have an impact on the size of models to be measured, but generally this error was less than the resolution of QCT images.
2. The process of measurements. Although the algorithm could calculate the parameters automatically, feature points coordinate still need to be snapped manually. The process of repeated snapping may produce visual errors, which was about 0.01mm in repeated measurements.
3. From the comparison results in Table 4 we found that there were significant differences between two measurements in HH, OFF, TOF, ND and NL. Traditional measurement only measured the parameters on projection, which cannot reflect the 3D morphological information of proximal femur accurately. So the reliability of the fracture risk predicted from the 2D parameters reduced, and even reached the contrary conclusion. As 3D morphological parameters were more accurately than 2D parameters, the data measured were much closer to the true values. Correlation result in Table 2 showed that BMD did not correlate with most of the morphological parameters. However, BMD and morphological parameters were all important indicators that can reflect fracture risk. So we cannot only focus on BMD or morphology of proximal femur for fracture risk assessment. These two factors should be taken into account together so that the accuracy of femoral strength prediction and fracture risk prediction can be improved.
The morphology of male femur might be different from female femur, so during the measurement process, we eliminated gender impact factor and only measured male samples. Post-menopausal female generally have severe osteoporosis. Therefore, the choice of female age groups was quite different from male. In the future study, we will take measurement and analysis for female samples.
Acknowledgements
This work is supported by the National Natural Science Foundation of China (Nos. 10832012, 10872078 and 10972090) and Scientific Advancing Front and Interdiscipline Innovation Project of Jilin University (No. 200903169).
References
- El-Kaissi S, Pasco JA, Henry MJ, Panahi S, Nicholson JG, Nicholson GC, Kotowicz MA. Femoral neck geometry and hip fracture risk: the Geelong osteoporosis study. Osteoporosis Int. 2005; 16(10): 1299-1303.
- Mazess RB, Barden HS, Drinka PJ, Bauwens SF, Orwoll ES, Bell NH. Influence of age and body weight on spine and femur bone mineral density in U.S. white men. J Bone Miner Res. 1990; 5(6): 645-652.
- Hemenway D, Feskanich D, Colditz GA. Body height and hip fracture: a cohort study of 90000 women. Int J Epidemiol. 1995; 24(4): 783-786.
- De Laet C, Kanis JA, Oden A, Johanson H, Johnell O, Delmas P, Eisman JA, Kroger H, Fujiwara S, Garnero P, McCloskey EV, Mellstrom D, Melton LJ 3rd, Meunier PJ, Pols HA, Reeve J, Silman A, Tenenhouse A. Body mass index as a predictor of fracture risk, a metaanalysis. Osteoporosis Int. 2005; 16(11): 1330-1338.
- Cummings SR, Black DM, Nevitt MC, Browner W, Cauley J, Ensrud K, Genant HK, Palermo L, Scott J, Vogt TM. Bone density at various sites for prediction of hip fractures. The Lancet. 1993; 341(8837): 72-75.
- Gluer CC, Cummings SR, Pressman A, Li J, Gluer K, Faulkner KG, Grampp S, Genant HK. Prediction of hip fractures from pelvic radiographs: the study of osteoporotic fractures. Journal of bone and mineral research. 1994; 9(5): 671-677.
- Faulkner KG, Cummings SR, Black D, Palermo L, Gluer CC, Genant HK. Simple measurement of femoral geometry predicts hip fracture: the study of osteoporotic fractures. J Bone Miner Res. 1993; 8(10): 1211- 1217.
- Gnudi S, Ripamonti C, Gualtieri G, Malavolta N. Geometry of proximal femur in the prediction of hip fracture in osteoporotic women. The British Journal of Radiology. 1999; 72(860): 729-733.
- Michelotti J, Clark J. Femoral neck length and hip fracture risk. J Bone Miner Res. 1999; 14(10): 1714-1720.
- Boonen S, Koutri R, Dequeker J, Aerssens J, Lowet G, Nijs J, Verbeke G, Lesaffre E, Geusens P. Measurement of femoral geometry in type I and type II osteoporosis: differences in hip axis length consistent with heterogeneity in the pathogenesis of osteoporotic fractures. J Bone Miner Res. 1995; 10(12): 1908-1912.
- Crabtree NJ, Kroger H, Martin A, Pols HA, Lorenc R, Nijs J, Stepan JJ, Falch JA, Miazgowski T, Grazio S, Raptou P, Adams J, Collings A, Khaw KT, Rushton N, Lunt M, Dixon AK, Reeve J. Improving risk assessment: hip geometry, bone mineral distribution and bone strength in hip fracture cases and controls. Osteoporosis Int. 2002; 13(1): 48-54.
- Peacock M, Turner CH, Liu G, Manatunga AK, Timmerman L, Johnston CC Jr. Better discrimination of hip fracture using bone density, geometry and architecture. Osteoporosis Int. 1995; 5(3): 167-173.
- Alonso CG, Curiel MD, Carranza FH, Cano RP, Perez AD. Femoral bone mineral density, neck-shaft angle and mean femoral neck width as predictors of hip fracture in men and women. Osteoporosis Int. 2000; 11(8): 714-720.
- Karlsson KM, Sernbo I, Obrant KJ, Redlund-Johnell I, Johnell O. Femoral neck geometry and radiographic signs of osteoporosis as predictors of hip fracture. Bone. 1996; 18(4): 327-330.
- Pulkkinen P, Partanen J, Jalovaara P, Jamsa T. Combination of bone mineral density and upper femur geometry improves the prediction of hip fracture. Osteoporosis Int. 2004; 15(4): 274-280.
- Sariali E, Mouttet A, Pasquier G, Durante E. Three- Dimensional Hip Anatomy in Osteoarthritis: Analysis of the femoral offset. The Journal of Arthroplasty. 2009; 24(6): 990-997.
- Clarke IC, Gruen T, Matos M, Amstutz HC. Improved method for quantitative radiographic evaluation with particular reference to total hip arthroplasty. Clinical Orthopaedics & Related Research. 1976; 121: 83-91.
- Faulkner KG, McClung M, Cummings SR. Automated evaluation of the hip axis length for predicting hip fracture. J Bone Miner Res. 1994; 9(7): 1065-1070.
- Pocock NA, Noakes KA, Majerovic Y, Griffiths MR. Magnification error of femoral geometry using fan beam densitometers. Calcif Tissue Int. 1997; 60(1): 8- 10.
- Braten M, Terjesen T, Rossvoll I. Femoral anteversion in normal adults. Ultrasound measurement in 50 men and 50 women. Acta Orthop Scand. 1992; 63(1): 29-32.
- Mahaisavariya B, Sitthiseripratip K, Tongdee T, Bohez EL, Vander Sloten J, Oris P. Morphological study of the proximal femur: a new method of geometrical assessment using 3-dimensional reverse engineering. Medical Engineering &Physics. 2002; 24(9): 617-622.
- Linwei Lv, Guangwei Meng, Weimin Zhu, He Gong, Dong Zhu, Xizheng Zhang. Relationships between the three-dimension morphologic parameters of proximal femurs. 2010 3rd International Conference on Biomedical Engineering and Informatics. 2010; 511-513.
- Dong X, Zheng GY. Fully automatic determination of morphological parameters of proximal femur from calibrated fluoroscopic images through particle filtering. Lecture Note in Computer Science. 2006; 4142: 535- 546.
- Chantarapanich N, Sitthiseripratip K, Mahaisacariya B, Wongcumchang M, Siribodhi P. 3D Geometrical Assessment of Femoral Curvature: A Reverse Engineering Technique. J Med Assoc Thai. 2008; 91(9): 1377-1381.
- Song WW, Ou ZY, Zhao DW, Wang WM. Comupteraided Modeling and Morphological Analysis of Hip Joint. The 1st International Conference on Bioinformatics and Biomedical Engineering. 2007; 1218-1221.
- Kaneuji A, Matsumoto T, Nishino M, Miura T, Sugimori T, Tomita K. Three-dimensional morphological analysis of the proximal femoral canal, using computeraided design system, in Japanese patients with osteoarthrosis of the hip. J Orthop Sci. 2000; 5(4): 361- 368.
- [Aroonjarattham P, Jiamwatthanachai P, Mahaisavariya B, Kiatiwat T, Aroonjarattham K, Sitthiseripratip K. Three-Dimensional Morphometric Study of the Thai Proximal Humerus: Cadaveric Study. J Med Assoc Thai. 2009; 92(9): 1191-1197.
- Rubin PJ, Leyvraz PF, Aubaniac JM, Argenson JN, Esteve P, de Roguin B. The morphology of the proximal femur: A three-dimensional radiographic analysis. J Bone Joint Surg [Br]. 1992; 74(1): 28-32.
