ISSN: 0970-938X (Print) | 0976-1683 (Electronic)
Biomedical Research
An International Journal of Medical Sciences
Research Article - Biomedical Research (2020) Volume 31, Issue 3
Analysis of feature extraction techniques using lung cancer image in computed tomography
School of EEE, Sathyabama Institute of Science and Technology, Chennai, India
- Corresponding Author:
- Pandian R
School of EEE
Sathyabama Institute of Science and Technology
Chennai
India
Accepted date: May 26, 2020
The precise identification and characterization of small pulmonary nodules at low-dose CT is a necessary requirement for the completion of valuable lung cancer screening. It is compulsory to develop some automated tool, in order to detect pulmonary nodules at low dose CT at the beginning stage itself. The numerous algorithms had been proposed earlier by many researchers in the past, but, the accuracy of prediction is always a challenging task. In this work, an artificial neural network based methodology is proposed to find the irregular growth of lung tissues. Higher probability of detection is taken as a goal to get an automated tool, with great accuracy. The finest feature sets derived from Haralick Gray level co-occurrence Matrix and used as the dimension reduction way for feeding neural network. In this work, a binary Binary classifier neural network has been proposed to identify the normal images out of all the images. The capability of the proposed neural network has been quantitatively computed using confusion matrix and found in terms of classification accuracy.
Keywords
GLCM, Classification accuracy, Texture, Classification.
Introduction
Cancer is uncontrolled proliferation of cells with a tendency to invade locally and spread distantly. Cancer is a heterogeneous group of diseases. India has around 2.2 million cases with over one lakh new cases being registered every year, according to cancerindia.org-National Institute of Cancer Prevention and Research. In the year 2018, the disease led to nearly sevenlakh deaths. The Indian Council of Medical Research (ICMR) estimates that the country is likely to record overseventeenlakh new cases and report overeight lakh deaths by 2020.There are abouttwo hundredtypes of Cancers and broadly they are classified and Blood Related Cancers and Solid Tumors. Nomenclature of Cancer is done on the basis of their origin or the Primary site of the tumor [1]. Nomenclature is based on, Cell of Origin, Site of Origin, Stage of Disease. Blood Cancers are Cancers that begins in blood-forming tissue, such as the bone marrow, Orin the cells of the immune system. Examples of blood cancer are - leukaemia, lymphoma, and multiple myeloma. Leukaemia: Leukaemia is a blood cancer caused by a rise in the number of white blood cells (WBC) in body. Lymphoma: Lymphoma is cancer that begins in infectionfighting cells of the immune system, they are called lymphocytes. These cells are present in the lymph nodes, spleen, thymus, bone marrow, and other parts of the body. Multiple Myeloma: In multiple myeloma, a type of white blood cell called a plasma cell multiplies unusually and spreads in the body. Normally, they make antibodies that fight against infections. But in multiple myeloma, they release too much of protein into your bones and blood which builds up throughout your body and causes organ damage. Common cancers are in India - 40% of Cancers in Male are tobacco related Majority comes in advancedstages; Vaccination for Cervical Cancer prevention is available and can be administered to girls in the age group of 9-15 years i.e. HPV- Human Papilloma Virus Vaccine [2,3]. The paper is structured as follows. Section 2 deals with Image data base and section 3 explain the Texture feature techniques. Classification of images is explained in section 4. In section 5, this research work is concluded.
Image Data Base
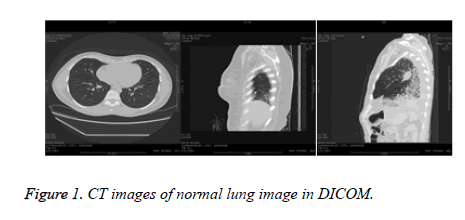
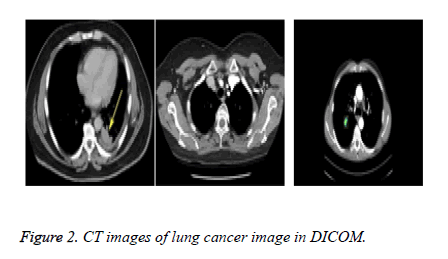
In this work CT Lung Image is used for classification. Here normal and cancer images taken from 50 different peoples [4-6]. CT Lung images Classified as CT Lung axial view images, CT Lung sagittal view images and CT Lung coronel view. The normal Lung image and cancer images are shown in Figures 1 and 2 [7,8].The datasets generated during the current study are available from the corresponding author on reasonable request.
Haralick Texture Features
Since the consistency of a characterization strategy is reliant principally on the right determination of the capacity, an adequate scope of ascribes should be characterized. A Gray level co-variance matrices (GLCM) is utilized in this anticipated examination that is a numerical methodology that permits utilization of the pixel transient affiliation. By applying the GLCM, it is make sense of which credits are to be made relying upon the bunch of a pixel. The creator proceeded with the examination of controlling the circulation of GLCM includes in such a manner and proposed a progression of insights that are invariant to revolution. The scalar invariant qualities of pivot might be gotten from vectors of co-event by taking the normal and appropriation of each type of capacity over the four shapes that are utilized. Another sort of meaning of the surface is the dark level variety information, which is legitimately connected to GLCM. A lattice of co-event, additionally called a conveyance of co-event, is determined over a picture to be the range of co-happening components at a characterized balance [9]. It portrays the auxiliary relationship of separation and point over a picture sub-district of comparative scale. The GLCM is framed from an image on a Gray level. The GLCM is estimated how much a dark level pixel esteem I shows up evenly, vertically, or corner to corner to neighbouring pixels with the worth j. The dark level coevent is a notable factual technique for acquiring surface subtleties from photos in the subsequent request. One of the most well-known and effective kinds of attributes in surface assessment is the GLCM vector. GLCM is the vector of all amounts for all dim level couples for a region recognized by a client set edge. For this procedure, as opposed to the first dim level pixel amounts, qualities are resolved dependent on the outright inconsistencies between couples of dark lines or mean dim lines. This element makes the figures somewhat more dependable for contrasts of lighting than in the GLCM circumstance. The vector of the frequency of the gray level coextracts from the above images. For this study, classification may be identified as the recognition function within which a collection of category the picture belongs, either regular or impaired by cancer [10].
Classification of Images
In this work Back Propagation network classifier is used determining the cancer disease. Classification is commonly encountered decision making tasks of human activity. The classification is called as the identification task to which a set of the group, a new observation belongs, on the basis of training a set of data containing observations. Here, the different CT images are the groups and the training data include the features, which were extracted from normal and abnormal images In this work, the BPN network is used for classifying the CT images [11]. The features are extracted from CT images of normal lung and cancer affected lung are taken into the study. GLCM based features are very useful in identifying diseases since the features are showing the wide difference between the two classes. The Back-Propagation Network (BPN) is employed to classify these images. The accuracy of the network is varied in order to improve the classification of the classes based on the ability of developed algorithm. The derived features, which are tabulated in Table 1, gives a wide difference between the normal and cancer images and the proposed compression algorithms do not affect the values much [12]. The optimum algorithm is chosen based on the classification accuracy.
| Features | Normal Lung | Cancer Lung |
|---|---|---|
| Image entropy | 5.73 | 4.77 |
| Auto correlation | 21.56 | 7.94 |
| Contrast | 0.56 | 0.34 |
| Correlation | 0.93 | 0.95 |
| Cluster promience | 535.46 | 648.78 |
| Cluster shade | 82.96 | 78.95 |
| Dissimilarity | 0.25 | 0.23 |
| Sum of square | 21.71 | 8.04 |
| Sum of average | 8.52 | 4.45 |
| Sum of variance | 61.93 | 19.47 |
| Information measure of correlation | 0.61 | 0.63 |
| INM | 0.97 | 0.98 |
| Energy | 0.31 | 0.28 |
| Maximum probality | 0.52 | 0.54 |
| Homogeneity | 0.91 | 0.89 |
Table 1: GLCM image feature of normal and cancer lung image.
From the above table it is clearly understand that proposed BPN classifier trained to classify the cancer images.
Conclusion
In this work, the algorithm is developed for classify the cancer images. The features are extracted from CT images of normal Lung and Cancer affected Lung is taken into the study. Even though, each disease type has unique characteristics and patterns, some similarities are also found among these categories that will lead to difficulty in designing a classifier with a correct decision boundary. Hence, the selection of features is a complex problem, which is overcome by careful trial and error process. Moreover, efficient feature selection is still a problem in medical Images and it can be addressed in future, in an effective manner to achieve better results. The classification accuracy of the Binary classifier finds the proposed algorithms suitable for identifying the cancer disease.
References
- Said A, Pearlman WA. An image multi resolution representation for lossless and lossy compression. IEEE T Image Process 1996;9:1303-1310.
- Deng C, Lin W, Cai J. Content-based image compression for arbitrary-resolution display devices. IEEE T Multimedia 2012;14:1127-1139.
- D Davis LS, Johns SA, Aggarwal JK. Texture analysis using generalized co-occurrence matrices. IEEE Trans Pattern Anal Mach Intell 1979:251-259.
- Haralick RM, Shanmugam K, Dinstein IH. Textural features for image classification. EEE Trans Syst Man Cybern 1973:610-621.
- Weszka JS, Dyer CR, Rosenfeld A. A comparative study of texture measures for terrain classification. EEE Trans Syst Man Cybern 1976:269-285.
- Pandian R, Vigneswaran T, Lalithakumari S. Characterization of CT cancer lung image using image compression algorithms and feature Extraction. J Sci Ind Res 2016;75:747-751.
- Pandian R, Vigneswaren T. Adaptive wavelet packet basis selection for zerotree image coding. Int J Signal Imag Syst Eng 2016;9:388-392.
- El-Bazl A, Farag AA, Falk R, La Rocca R. Automatic identification of lung abnormalities in chest spiral CT scans. ICASSP 2003;2:261-264.
- Pandian R. Evaluation of image compression algorithms. Under water Tech 2015;1-3.
- Kanazawa K, Kawata Y, Niki N , Satoh H , Ohmatsu H, Kakinuma R , Kaneko M, Moriyama N and Eguchi K. Computer aided diagnosis for pulmonary nodules based on helical CT image. Comput Med Imag Grap 1998;22:157-167.
- Lina D, Yan C. Lung nodules identification rules extraction with neural fuzzy network. Adv Neural Inf Process Syst 2002;4:2049-2053.
- Zhang GP. Neural networks for classification survey. IEEE T Syst Man Cyb 2002;30:451-462.

