ISSN: 0970-938X (Print) | 0976-1683 (Electronic)
Biomedical Research
An International Journal of Medical Sciences
Research Article - Biomedical Research (2017) Volume 28, Issue 10
Application of computer aided design and fused deposition modeling technology in the digital manufacture of orthodontic study models
Siwei Wang1, Min Li2, Huifang Yang3, Yi Liu1* and Yuchun Sun3*
1Department of Orthodontics, Peking University School and Hospital of Stomatology, No. 22 South Street, Zhongguancun, Haidian District, Beijing, PR China
2Department of Orthodontics, the Affiliated Hospital of Guizhou Medical University, NO.28 Guiyi Street, Yunyan District, Guiyang, PR China
3Center of Digital Dentistry, Peking University School and Hospital of Stomatology, Department of Prosthodontics, Peking University School and Hospital of Stomatology, National Engineering Laboratory for Digital and Material Technology of Stomatology, Research Center of Engineering and Technology for Digital Dentistry of Ministry of Health, Beijing Key Laboratory of Digital Stomatology, PR China
- *Corresponding Author:
- Yi Liu
Department of Orthodontics
Peking University School and Hospital of Stomatology, PR China
- Yuchun Sun
Department of Prosthodontics
Center of Digital Dentistry
Peking University School and Hospital of Stomatology and
National Engineering
Laboratory for Digital and Material Technology of
Stomatology and Research Center of Engineering and
Technology for Digital Dentistry of Ministry of Health, PR China
Accepted on February 24, 2017
Background: The orthodontic models can be divided into two categories, namely, working models and study models. Shaping study model is required for orthodontists. Traditionally, we shape the model with a trimmer or a base. The objective of this study was to establish the process of manufacturing orthodontic study models with the support of Computer-Aided Design (CAD) and Fused Deposition Modeling (FDM) technology, and to evaluate the accuracy of the whole process through comparing with traditional plaster models.
Method: 15 sets of plaster models were divided into the mild crowding group (n=6), the moderate crowding group (n=9), and the severe crowding group (n=15). The surface data of plaster models, which was used to design the digital base in OrthoAnalyzer software, was obtained by a 3D model scanner. Through a chairside 3D printer, the designed models were converted into 3D printing models (3DP models). Linear measurements and 3D deviation analysis were taken on plaster models and 3DP models to evaluate the accuracy of the whole process.
Results: Generally, 3DP models and plaster models demonstrated the same occlusion relationship and dental arch morphology. The Bland-Altman analysis results indicated that the 3DP models had excellent consistency with plaster models. The result of Kruskal-Wallis one-way analysis of variance demonstrated that the differences in crown width between the plaster models and the 3DP models among different groups showed no statistical significance (p=0.858, F=0.306).
Conclusions: The environmentally-friendly and efficient manufacture process of orthodontic study model was established, and its accuracy satisfied the requirements of clinical application.
Keywords
Orthodontics, Study model, Computer-aided design (CAD), Fused deposition modeling (FDM), Accuracy.
Introduction
Plaster models, as accurate reproductions of the teeth and surrounding soft tissues, can provide a three dimensional view of the dentition. In the modern orthodontics history, plaster models have played an important role in diagnostic analyses and treatment procedures. The orthodontic models, based on different purposes, are usually divided into two types, namely working models and study models [1]. As for the working models, they are always applied to the fixed or removable appliance production process [2,3]. Study models can record the occlusion before, during and after the treatment, while on the other hand, they serve as an essential part in case reports [4,5]. Therefore, shaping study model into certain morphology is required for orthodontists, in order to facilitate proper diagnosis, treatment planning and long-term storage. Traditionally, the model is shaped with a trimmer or a base manually [6]. However, the whole process is relatively complex, with each step affecting the final results.
In the past few years, it has been widely accepted that plaster models are faced with some shortcomings that cannot be overcome, such as the fragility of being damaged and lost. Besides, they occupy a large amount of actual storage space [7], and they are inconvenient in transportation. Meanwhile, with the rapid development of computer technology and threedimensional reconstruction technology, digital models have gained gradual popularity. On one hand, digital models can overcome the shortcomings of traditional plaster models. On the other hand, they make it easy to observe and measure models from any angle or at any magnification. Besides, they can act as information carriers for online remote orthodontic diagnosis and treatment. In most researches, it would be approved that the accuracy of digital models is enough for clinical application [8,9]. As a result, digital models are recommended as an alternative for traditional plaster models [10]. However, for most orthodontists, the actual models are more familiar and more realistic compared with threedimensional image on the computer. 3D printer could print out the three-dimensional physical models based on patients’ data. Consequently, the clinicians can read the patients’ data from the database and print at any time during the treatment process.
In recent years, advances in Computer-Aided Design and Computer-Aided Manufacturing (CAD/CAM) provide new possibilities in dental practices [11,12]. However, before 3D printing can be implanted, its accuracy and reproducibility should be evaluated. Barker et al. [13] found a mean difference of 0.85 mm between dried skull and duplicated stereolithographic models. Kragskov et al. [14] found differences ranging from 0.3 mm to 0.8 mm between 3D CT scan images and stereolithographic models. However, there are only a few of publications on the digital design and manufacture of orthodontic study models and the accuracy evaluation of this digital process is still lacking.
Therefore, this study aimed to establish the digital manufacture process of orthodontic study models with the support of Computer-Aided Design (CAD) and Fused Deposition Modeling (FDM) technology to improve the success rate and reduce the labor and economic costs compared with the traditional model shaping methods; moreover, it aimed to verify the accuracy of the whole process through the comparison with traditional plaster models; at last, it aimed to explore the feasibility of its replacing of traditional methods.
Materials and Methods
Samples
Plaster study models of 15 patients were selected from a cohort of patients from the Department of Orthodontics, Peking University School of Stomatology from 2009 to 2015. Inclusive criteria: (1) a permanent dentition, fully erupted from the left first molar to the right first molar, (2) normal crown morphology, and no significant tooth wear or defect (3) highquality dental casts without broken parts or air bubbles. Among the 15 patients with the average age 17.3 ± 4.6 years, 6 were male, and 9 were female; all of them were informed consent. The models mentioned above were divided into three groups according to different degrees of crowdedness. As a result, a total of 30 high-quality mandibular and maxillary models consisted of 6 mild crowded, 9 moderate crowded and 15 severe crowded single casts.
3DP models preparation
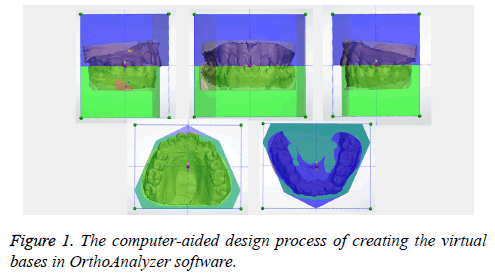
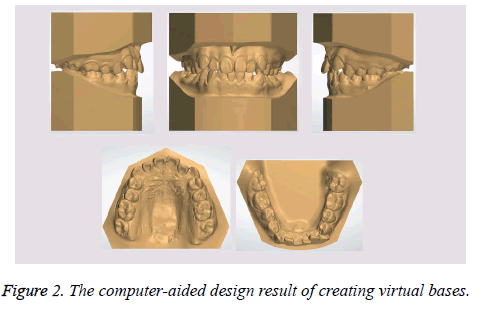
All plaster models were scanned by a 3D model scanner (R700, 3shapeA/S, Denmark) with the accuracy of 20μm to obtain surface models. OrthoAnalyzer software (3shapeA/S, Copenhagen, Denmark) was employed to design the virtual bases. First, we placed the spline points over the model curve to define the cut. Once maxilla and mandible splines had been placed, we went to the fit base step. In this step, we chose the shapes and modified the sizes of the bases for our models. Finally, we removed small air bubbles or tumors, and saved the designed models as STL files (Figures 1 and 2).
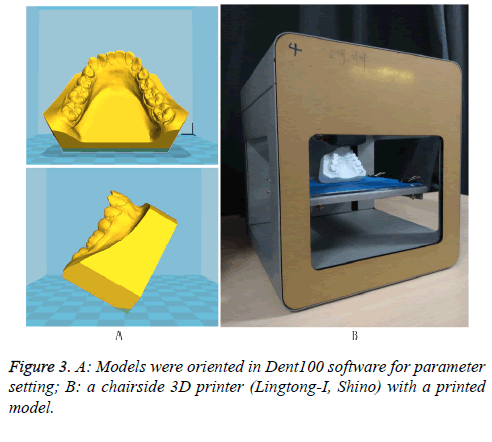
These STL files were imported to Dent100 software (Beijing Shino Company, China) for parameter setting. Through a chairside 3D printer (Lingtong-I, Shino), these files were converted into 3D printing models (3DP models) (Figure 3). The parameters of the chairside 3D printing system were set as follows: printing technology protocol: FDM (fused deposition modeling), nozzle diameter: 0.4 mm, positioning accuracy: X, Y: ± 0.01 mm, Z: ± 0.005 mm, layer resolution: 100 μm, printing speed: 60 mm/s, heated temperature: 200°C, overlap rate: 15%, material: 1.75 mm Polylactic Acid (PLA). The models were oriented to make the angle between the back of the base and the horizontal plane is 30° (Figure 3) thus ensuring that there was no obvious defect on the surface of 3D printing model.
Accuracy evaluation
Measurement procedure: Similar linear measurements were taken on plaster models and 3DP models by a single trained evaluator after the initial training. A hand-held digital caliper (Shenhan, China, accuracy 0.01 mm) was used to measure both the mesiodistal crown width of all teeth (from the left first molar to the right first molar) and the arch width. Moreover, in the experiment, a special arch length ruler (accuracy 0.1 mm) was used to measure the arch length. All measurements were performed twice with an internal of two weeks. Furthermore, under the consistent condition, another trained evaluator repeated the same measurements. In addition, intraobserver correlation coefficient and interobserver correlation coefficient were calculated to evaluate the reproducibility of this method.
The linear measurements were described as (1) mesiodistal measurement of all the teeth (from the left first molar to the right first molar), taken at their greatest width, (2) arch width. First, it is the anterior segment arch width: from the cusp tip or the abrasion surface of the right canine to that of the left canine; then, it is the middle segment arch width: from the buccal cusp tip or the abrasion surface of the right first premolar to that of the left first premolar; finally, it comes to the posterior segment arch width: from the mesiobuccal cusp tip or the abrasion surface of the right first molar to that of the left first molar, (3) arch length. First, anterior arch length: vertical distance from the most prominent point of incisor to the line of cusp tip of the right canine and that of the left canine; then, middle segment arch length: vertical distance between the line of cusp tip of bilateral canine and the line of mesio-contact point of bilateral first molar; at last, total arch length: vertical distance from the most prominent point of incisor to the line of disto-contact point of bilateral first molar.
Statistical analyses: Bland-Altman analysis was employed to determine the agreement between plaster models and 3DP models. Before the statistical analysis was conducted among different groups, we performed the tests of Normality. Kruskal Wallis one-way analysis of variance was adopted in order to verify whether the precision of 3DP models was affected by different degrees of crowdedness if our sample did not conform to the normal distribution. The statistical calculations were performed with the support of SPSS software (Version 20.0, IBM, Chicago) on the significance level p=0.05.
3D deviation analysis
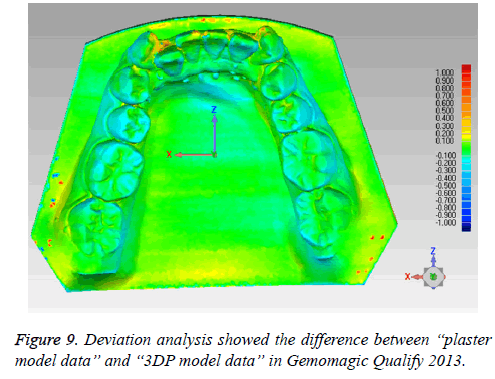
Compared manual measurements of plaster models with its corresponding 3DP models, the one showing the maximum manual measurement differences was thus selected for deviation analysis. Deviation analysis was carried out as follows: the elected 3DP model was scanned using a 3D model scanner (R700, 3shapeA/S, Denmark), which with an accuracy at 20 μm, and were exported as .stl files. The 3DP model data, along with the original plaster model data, was imported into commercial software (Geomagic Qualify 2013, USA) to perform the deviation analysis. Moreover, the plaster model data were selected as the reference, while positive deviation was defined as 3DP model surface data protruding along the normal direction of plaster model data. In addition, the software automatically measured the mean deviation and provided color maps of all best-fit alignment images.
Results
The intraobserver correlation coefficient was 0.999 (95% confidence interval, 0.999-1.000), and interobserver correlation coefficient was 0.996 (95% confidence interval, 0.995-0.998), indicating the reliability of all the measurements.
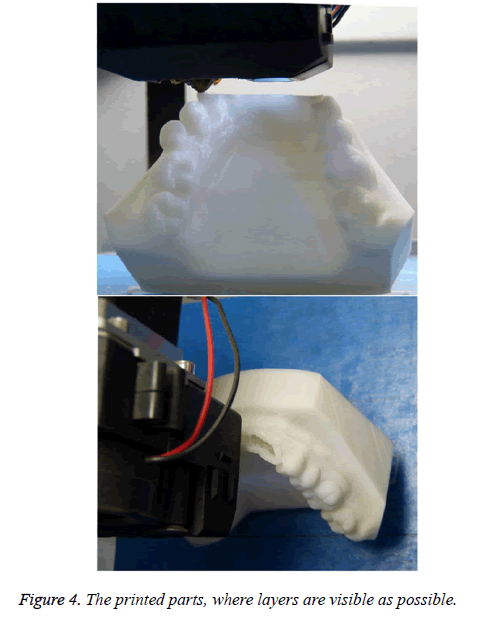
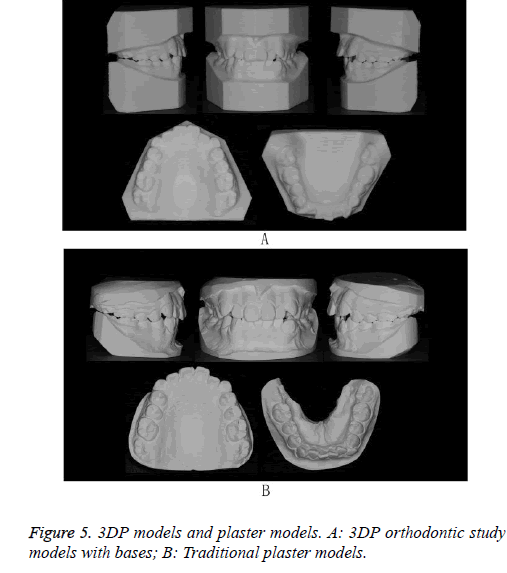
Figure 4 showed the printed parts, where layers are visible as possible. As shown in Figure 5, 3DP models and plaster models demonstrated the same occlusion relationship and dental arch morphology.
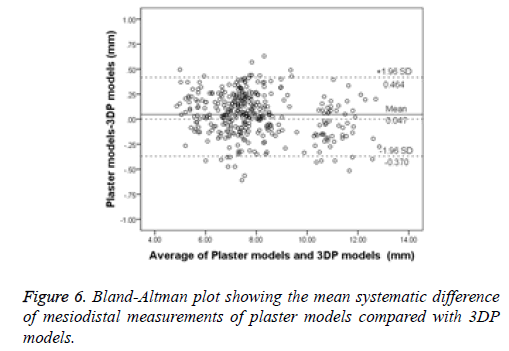
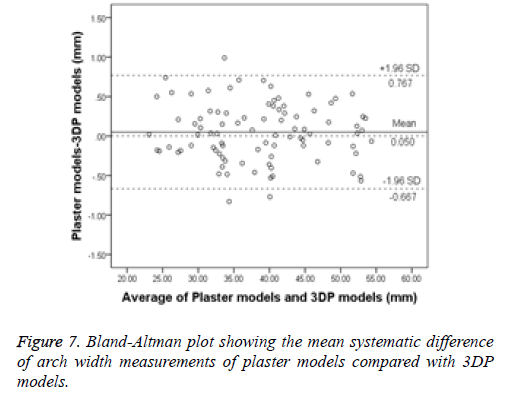
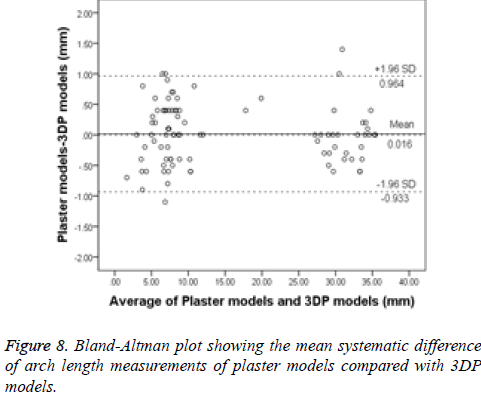
According to the Bland-Altman analysis results, the mean systematic differences were 0.047 mm for mesiodistal crown width (limits of agreement, -0.370 to 0.464 mm), 0.050 mm for arch width (limits of agreement, -0.667 to 0.767 mm) and 0.016 mm for arch length (limits of agreement, -0.933 to 0.964 mm). As shown in the Bland-Altman plots (Figures 6-8), a high agreement existed between plaster and 3DP models. The result of Kruskal-Wallis one-way analysis of variance demonstrated that the difference in crown width between the plaster models and the 3DP models among different groups showed no statistical significance (p=0.858, F=0.306) (Table 1).
| Group | Numbers | Plaster models-3DP models (mean ± S.D.) (mm) | Shapiro-Wilk1 | F value | p value |
|---|---|---|---|---|---|
| Mild crowded | 6 | 0.170 ± 0.060 | 0.097 | 0.306 | 0.858 |
| Moderate crowded | 9 | 0.188 ± 0.027 | 0.361 | ||
| Sever crowded | 15 | 0.237 ± 0.249 | 0.000* |
Table 1. Kruskal-Wallis one-way analysis of variance of mesiodistal measurements difference among mild crowded, moderate crowded and severe crowded groups.
Figure 9 showed the deviation analysis result of difference between “plaster model data” and “3DP model data” in ranging from -1.000 mm to +1.000 mm. It was shown that there was the homogenous deviation over the entire dental arch with the maximum values on the edge of lower incisors and the undercut of canine. There, areas in green color showed a good match, red color areas represented positive error, and blue color indicated negative error. The mean deviation was -0.30 mm.
Discussion
This study is mostly featured by the ability to design and print high accuracy orthodontic study models using digital 3D technology. In general, the dental technicians prepare the study models, and make them more appealing and functional. It can be realized by shaping them into a standard pattern and trimming them to improve their aesthetic nature. In terms of the model shaping, a model trimmer or a rubber base can be used. The basic steps include the duplication, trimming, grinding as well as polishing. The whole process is relatively complex, with each step affecting the final results. If failure is encountered in any step, the entire process may need to start again. With the assistance of CAD, the model can be trimmed and the virtual bases can be created digitally based on the scanned data. Moreover, the shape and size of the bases can be modified according to different customized requirements. During the whole digital process, returning to the previous step for modification has always been available. Furthermore, the final STL files can be imported to other software for further analyses or production. Usually, the Computer-Aided Manufacturing (CAM) process can be completed with the support of 3D printing. In this study, the FDM technology was applied to the 3D printer, which worked on the principle of temperature-controlled head extruding thermoplastic material layer by layer [15,16]. Besides, the Polyactic Acid (PLA) filament was used as the printing material; as a bio-resin extracted from corn, PLA was cheap, renewable and pollutionfree, suitable for the medical use [17,18]. This study, for example, took 80 minutes to print one mandibular cast with the base. However, with the start of the machine, the entire printing process will be completed automatically without monitoring. Thus actual time consumed for 3D scanning of primary model and the CAD procedure of the digital base was only about 10 min (5 min for scanning and 5 min for CAD). The whole process proposed in this study, could improve the success rate and reduces the labor and economic costs compared with the traditional model shaping methods. What’s more, the whole process was more environmentally- friendly compared with the traditional method [19].
It cannot be denied that it was essential to verify the accuracy of this digital process of manufacturing the orthodontic study model. However, according to these different clinical requirements and purposes, the model accuracy is not the same, and no previous study has defined the clinically acceptable measurement difference of 3DP models. Several previous studies comparing the plaster models with digital models showed the measurement difference less than 0.20 mm is clinically acceptable, because it is almost identical to the tolerance of manual measurement [8,9]. Another study conducted by Kim et al. [20] evaluated the accuracy and precision of the standard Polyurethane (PUT) dental arch models fabricated using a 3D subtractive rapid prototyping method, in which process an intraoral scanning technique was adopted. The result that the mean difference between plaster models and PUT models ranged from 0.07 mm to 0.33 mm was considered as clinically acceptable. Therefore, the results of our study on the measurement differences of 3DP models could be considered accurate enough for orthodontic study models, as the difference of mesiodistal measurements was close to Hazeveld’s study [21]. Different from previous researches, the sample of our study included common malocclusion and different levels of crowdedness. There was the result that the accuracy of the 3DP models was not affected by different degrees of crowdedness, thus indicating that the method proposed by us was practical on clinical application. However, the larger deviation between groups indicated that the stability of the printing results needed to be verified furthermore.
Errors exited in each step of the entire process, so the accuracy of the entire process was evaluated. The difference between the plaster models and 3DP models was a comprehensive reflection of scanning errors [22], data conversion errors [23,24] and printing errors [25,26]. According to the 3D deviation analysis results, the maximum difference appeared such areas as the edges of lower incisors and the undercuts of canine, where was also difficult to scan. The mean difference of deviation analysis might be caused by the shrinkage of the printing material’s cooling and solidification process from the molten state, thus proving the requirement of the precompensation. Though other commercial 3D printing systems, such as Stereolithography Apparatus (SLA) could print out more accurate dental models, the high costs might restrict its clinical application [27].
The results of this study showed that the accuracy of our 3DP study model was within the clinically acceptable range; however, the texture and tactile impression of the 3DP models were totally different from those of the traditional plaster models that the orthodontists were accustomed to using. In the future, an attempt can be made to use the printing material that has a color closer to the plaster. Even, there could be the attempt to use the printing material with different colors to print the dental crown, the surrounding soft tissues and the base plate to make the study model more real.
Conclusions
This study established a digital manufacture process of orthodontic study models with the support of Computer-Aided Design (CAD) and Fused Deposition Modeling (FDM) technology the environmentally-friendly and efficient manufacture process of orthodontic study model was established, and its accuracy satisfied the requirements of clinical application.
Acknowledgements
This study was supported by funding from National Natural Science Foundation of China (grant no. 81550018), the Capital Health Research and Development of Special (grant no. 2016-1-4101) and the Program for New Clinical Techniques and Therapies of Peking University School and Hospital of Stomatology (grant no. PKUSSNCT-16A06).
References
- Minkui F. Orthodontics. Beijing Peoples Medical Pulishing House 2003.
- Sondhi A. Efficient and effective indirect bonding. Am J Orthod Dentofacial Orthop 1999; 115: 352-359.
- McNamara JA, Huge SA. The Frankel appliance (FR-2): model preparation and appliance construction. Am J Orthod 1981; 80: 478-495.
- Casko JS, Vaden JL, Kokich VG, Damone J, James RD, Cangialosi TJ, Riolo ML, Owens SE, Bills ED. American board of orthodontics Objective grading system for dental casts and panoramic radiographs. Am J Orthod Dentofacial Orthop 1988; 114: 589-599.
- Cangialosi TJ, Riolo ML, Owens SE, Dykhouse VJ, Moffitt AH. The ABO discrepancy index: a measure of case complexity. Am J Orthod Dentofacial Orthop 2004; 125: 270-278.
- Minkui Fl, Haiping HW. Textbook of orthodontics. Beijing Peoples Medical Publishing House 2007.
- McGuinness NJ, Stephens CD. Storage of orthodontic study models in hospital units in the U.K. Br J Orthod 1992; 19: 227-232.
- Santoro M, Galkin S, Teredesai M, Nicolay OF, Cangialosi TJ. Comparison of measurements made on digital and plaster models. Am J Orthod Dentofacial Orthop 2003; 124: 101-105.
- Quimby ML, Vig KW, Rashid RG, Firestone AR. The accuracy and reliability of measurements made on computer-based digital models. Angle Orthod 2004; 74: 298-303.
- Fleming PS, Marinho V, Johal A. Orthodontic measurements on digital study models compared with plaster models: a systematic review. Orthod Craniofac Res 2011; 14: 1-16.
- Salmi M, Tuomi J, Sirkkanen R, Ingman T, Makitie A. Rapid tooling method for soft customized removable oral appliances. Open Dent J 2012; 6: 85-89.
- Salmi M, Paloheimo KS, Tuomi J, Ingman T, Mäkitie A. A digital process for additive manufacturing of occlusal splints: a clinical pilot study. JR Soc Interface 2013; 10: 20130203.
- Barker TM, Earwaker WJ, Lisle DA. Accuracy of stereolithographic models of human anatomy. Australas Radiol 1994; 38: 106-111.
- Kragskov JS, Sindet-Pedersen C, Gyldensted K, Jensen L. A comparison of three-dimensional computed tomography scans and stereolithographic models for evaluation of craniofacial anomalies. J Oral Maxillofac Surg 1996; 54: 402-411.
- Azari A, Nikzad S. The evolution of rapid prototyping in dentistry-a review. Rapid Prototyping J 2009; 15: 216-225.
- van Noort R. The future of dental devices is digital. Dent Mater 2012; 28: 3-12.
- Pang X, Zhuang X, Tang Z, Chen X. Polylactic acid (PLA): research, development and industrialization. Biotechnol J 2010; 5: 1125-1136.
- Athanasiou KA, Niederauer GG, Agrawal CM. Sterilization, toxicity, biocompatibility and clinical applications of polylactic acid/polyglycolic acid copolymers. Biomaterials 1996; 17: 93-102.
- Ireland AJ, Wilson AA, Blythe L, Johnston NJ, Price R, Sandy JR. Particulate production during orthodontic production laboratory procedures. J Expo Sci Environ Epidemiol 2011; 21: 536-540.
- Kim JH, Kim KB, Kim WC, Kim JH, Kim HY. Accuracy and precision of polyurethane dental arch models fabricated using a three-dimensional subtractive rapid prototyping method with an intraoral scanning technique. Korean J Orthod 2014; 44: 69-76.
- Hazeveld A, Huddleston Slater JJ, Ren Y. Accuracy and reproducibility of dental replica models reconstructed by different rapid prototyping techniques. Am J Orthod Dentofacial Orthop 2014; 145: 108-115.
- Lemos LS, Rebello IM, Vogel CJ, Barbosa MC. Reliability of measurements made on scanned cast models using the 3 Shape R 700 scanner. Dentomaxillofac Radiol 2015; 44: 20140337.
- Cheah CM, Chua CK, Tan KH, Teo CK. Integration of laser surface digitizing with CAD/CAM techniques for developing facial prostheses. Part 1: Design and fabrication of prosthesis replicas. Int J Prosthodont 2003; 16: 435-441.
- Mah J, Hatcher D. Current status and future needs in craniofacial imaging. Orthod Craniofac Res 2003; 6: 10-16.
- Pennington RC, Hoekstra NL, Newcomer JL. Significant factors in the dimensional accuracy of fused deposition modelling. Proc Instit Mech Eng Part E J Process Mech Eng 2005; 219: 89-92.
- Anitha R, Arunachalam S, Radhakrishnan P. Critical parameters influencing the quality of prototypes in fused deposition modelling. J Mater Process Tech 2001; 118: 385-388.
- Kasparova M, Grafova L, Dvorak P, Dostalova T, Prochazka A, Eliasova H, Prusa J, KaKawand S. Possibility of reconstruction of dental plaster cast from 3D digital study models. Biomed Eng Online 2013; 12: 49.
