ISSN: 0970-938X (Print) | 0976-1683 (Electronic)
Biomedical Research
An International Journal of Medical Sciences
- Biomedical Research (2016) Volume 27, Issue 3
Cerebrovascular disorder diagnosis using MR angiography.
1Sr. Assistant Professor, Department of ECE, Madanapalle Institute of Technology & Science, Madanpalle
2Assistant Professor, Department of Biomedical Engineering,Sathyabama University, Chennai
- *Corresponding Author:
- Hari Krishnan G
Department of Electronics & Communication
Madanapalle Institute of Technology and Science
India
Accepted Date: February 28, 2016
In cerebrovascular disorder diagnosis computer-aided diagnosis of intracranial aneurysms, segmenting of high-intensity major vessels along with the low-contrast aneurysms is essential to the recognition of lethal vascular disease. This paper proposes a novel intensity-based algorithm to segment intracranial vessels and the attached aneurysms. The proposed method can handle intensity varying vasculatures and also the low-contrast aneurysmal regions affected by turbulent flows. It is grounded on the use of multi range filters and local variances to extract intensity-based image features for identifying contrast varying vasculatures. The extremely low-intensity region affected by turbulent flows is detected according to the topology of the structure detected by multi range filters and local variances. The proposed method is evaluated using a phantom image volume with an aneurysm and four clinical cases. Owing to the analogy between these variants and existing vascular segmentation methods, this comparison also exemplifies the advantage of the proposed method over the existing approaches.
Keywords
Segmentation, Intracranial aneurysm, Local variances, Lethal vascular disease, Novel intensity.
Introduction
The magnetic resonance imaging is to view the internal structures of the body in detail especially for imaging soft tissues and it does not use any radiations. Magnetic resonance imaging (MRI) is based upon the detection of radiofrequency signals emitted by protons within a powerful magnetic field. A segmentation of an angiography, quantitative analysis of abnormal structures can aid radiologists in choosing appropriate treatments and apparatuses [1]. The effective quantitation is only attainable if the abnormalities are identified from the vasculature. This, a novel method is developed, which works on the simpler shape of normal vessels to identify different vascular abnormalities [2]. A 3-D line enhancement filter is developed with the aim of discriminating line structures from other structures and recovering line structures of various widths. Multi-scale integration is formulated by taking the maximum among single- scale filter responses, and its characteristics are examined to derive criteria for the selection of parameters in the formulation [3]. The medical images are first pre-processed to remove the noises in them. The important regions in the images are segmented based on the intensity. Colour histogram features are extracted from the image [4]. The classifier matches the test image features and the train image features and then using the true label the defect is classified into bulge or aneurysm. If aneurysm is identified then the affected region is segmented. Finally the accuracy of the classifier is calculated [5]. It may involve enhancing the contrast, removing noise, or identifying regions likely to contain the postcode. To represent color images, separate red, green and blue components must be specified for each pixel (assuming an RGB colour space), and so the pixel `value' is actually a vector of three numbers. Often the three different components are stored as three separate `grayscale' images known as colour planes (one for each of red, green and blue), which have to be recombined when displaying or processing. Multispectral Images can contain even more than three components for each pixel, and by extension these are stored in the same kind of way, as a vector pixel value, or as separate colour planes [6].
The actual grayscale or color component intensities for each pixel may not actually be stored explicitly. Often, all that is stored for each pixel is an index into a color map in which the actual intensity or colors can be looked up. Although simple 8- bit integers or vectors of 8-bit integers are the most common sorts of pixel values used, some image formats support different types of value, for instance 32-bit signed integers or floating point values. Such values are extremely useful in image processing as they allow processing to be carried out on the image where the resulting pixel values are not necessarily 8-bit integers. If this approach is used then it is usually necessary to set up a color map which relates particular ranges of pixel values to particular displayed colors [7]. It analyses the weaknesses of these existing approaches and justifies the use of every component involved in the proposed method. It- is shown that the proposed method is capable of segmenting blood vessels and the attached aneurysms on PC-MRA images. Segmentation of intracranial vessels and aneurysms in phase contrast magnetic resonance angiography using multi range filters and local variances.
Materials and Methodologies
Gaussian noise is defined as the label assigned initially at any pixel and the pixel arrangement will be in random manner. Gaussian noise is statistical noise that has its probability density function equal to that of normal distribution, also called Gaussian distribution. The mean (average) and variances (standard deviation) are the defining factors [8]. Gaussian noise whose frequency spectrum after a Fourier transform has a bell shaped curve and is symmetric around mean. In order to test the resistance of an image and also to evaluate the performance of the MRA Brain image Gaussian noise is added and filtered using some noise filters. Each pixel in noisy image contains both true pixel values. Gaussian distribution equation is given below.
Once a suitable kernel has been calculated, then the Gaussian smoothing can be performed using standard convolution methods. The convolution can in fact be performed fairly quickly since the equation for the 2-D isotropic Gaussian shown above is separable into x and y components. Thus the 2- D convolution can be performed by first convolving with a 1-D Gaussian in the x direction, and then convolving with another 1-D Gaussian in the y direction. (The Gaussian is in fact the only completely circularly symmetric operator which can be decomposed in such a way.) The y component is exactly the same but is oriented vertically. This involves subdividing an image into constituent parts, or isolating certain aspects of an image such as circles, or particular shapes in an image. Segmentation is done based on the changes in the intensity of the pixels. The affected region will differ in the pixel intensity using that we identify the important regions in the image.
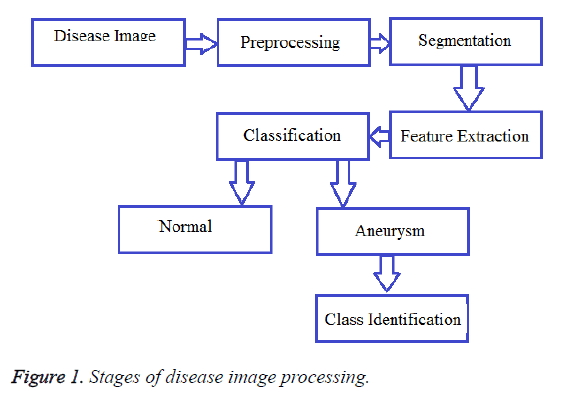
It is a graphical representation of the intensity distribution of an image. It quantifies the number of pixels for each intensity value considered. It is a graphical representation of the intensity distribution of an image. The stages of disease image processing are as shown in figure 1. It quantifies the number of pixels for each intensity value considered. Machine Learning is a field of study that gives computers the ability to learn without being explicitly programmed. Given a training set, we feed it into a learning algorithm (like SVM, Artificial Neural Network, Logistic Regression, Linear Regression etc). The learning algorithm then outputs a function, which for historical reasons is called the hypothesis. Basically the hypothesis’ job is to take a new input and give out an estimated output or class.
Results and Discussion
The parameters that define the hypothesis are what are “learned” by using the training set. After the feature set has been computed for each pixel, it will be used by a classifier to decide whether each pixel represents an aneurysm pixel or a normal pixel.
Based on the pixel based intensity values for the processed images the classification stage has two components, a training phase and a testing phase. In the training phase, pixel features and their corresponding manual labels represent the input, and the output is a model that uses the features to predict the corresponding label. This training phase needs to be done only once, since the model can then be used to classify new data [5].
The input to the testing phase is a learned model and pixel features without corresponding classes, and the output of the testing phase is the predicted classes for the pixels based on their features.
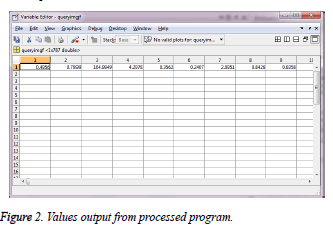
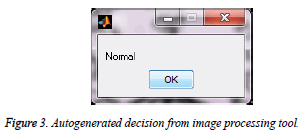
The values obtained from processed image are as shown in figure 2. The automated result obtained from the values based on its threshold is as shown in figure 3.
Conclusion
Low Signal to Noise Ratio of the resulting image. The affected regions are correctly classified. There is a strong need for a means of imaging vascular and other curvilinear anatomical structures with 3-D information and good image quality. The effects of structures other than line structures and effects of non-uniformity of contrast material are removed. The system can be effectively used for diagnosis of cerebrovascular disorder diagnosis using image processing tool like Matlab. The cerebrovascular disorder diagnosis was made using computer-aided diagnosis of intracranial aneurysms, segmenting of high-intensity major vessels along with the lowcontrast aneurysms and it was observed that it is essential to the recognition of lethal vascular disease.
References
- McLaughlinR, NobleJ.Demarcation of aneurysms using the seed and cull algorithm.Proc. Int. Conf. Med. Image Comput. Assisted Intervent 2002; 419–426.
- SatoY, NakajimaS, ShiragaN, Atsumi1H, YoshidaS, KollerT, GerigG, KikinisR. Three-dimensional multi-scale line filterfor segmentation and visualization of curvilinear structures in medical images, Med Image Anal 1998; 2:143–168.
- HernandezM, FrangiA.Non-parametric geodesic active regions: Method and evaluation for cerebral aneurysms segmentation in 3DRA and CTA. Med. Image Anal 2007; 11:224–241.
- Bogunovi´cH, PozoJ, Villa-UriolM.Automated segmentation of cerebral vasculature with aneurysms in 3DRA and TOF-MRA using geodesic active regions: An evaluation study.MedPhys 2011; 39: 210–222.
- Caselles V, Kimmel R, Sapiro G. Geodesic active contours.Int J Comput Vis 1997; 22: 61–79.
- Yu S, So W, Chung A, Lee K, Wong G. A compartmentalized volumetric system for outcome analysis of coiled cerebral aneurysms: Aneurysm coil mass-neck outcome assessment system. Neurosurgery 2009; 64: 149–154.
- Wong W and Chung A. Augmented vessels for quantitative analysis of vascular abnormalities and endovascular treatment planning. IEEE Trans MedImag 2006; 25: 665–684.
- Firouzian A, Manniesing R, Flach H, Risselada R, van Kooten F, Sturkenboom M, van der Lugt A, Niessen W. Intracranial aneurysm segmentation in 3D CT angiography: Method and quantitative validation with and without prior noise filtering. Eur JRadiol 2011; 79: 299–304.


