ISSN: 0970-938X (Print) | 0976-1683 (Electronic)
Biomedical Research
An International Journal of Medical Sciences
Research Article - Biomedical Research (2017) Volume 28, Issue 1
Comparison of 3d reformat computed tomography images using different softwares: do they have an incremental value in 3D imaging?
1Department of Radiology, School of Medicine, Near East University, Nicosia, Cyprus
2Department of Radiology, Istanbul Kanuni Sultan Suleyman Research and Training Hospital, Istanbul, Turkey
3Department of Informatics, Istanbul University, Istanbul, Turkey
4Department of Anatomy, Faculty of Medicine, Trakya University, Edirne, Turkey
5Department of Radiology, Medical faculty of Istanbul University, Istanbul, Turkey
6Department of Orthopedics and Traumatology, Dora Hospital, Istanbul, Turkey
7Department of Radiology, Şişli Pediatric Research and Training Hospital, Istanbul, Turkey
8Department of Ophthalmology, Acıbadem University, Küçükçekmece, Istanbul, Turkey
9Department of Public Health, Namık Kemal University, Tekirdag, Turkey
- *Corresponding Author:
- Hadi Sasani
Department of Radiology
School of Medicine
Near East University
Nicosia
Cyprus
Accepted on June 7, 2016
Three dimensional (3D) imaging gained an important diagnostic role because of providing the precise diagnosis in computed tomography (CT) studies. Various 3D softwares such as; VitreaWorkstation - Toshiba, Japan; OsiriX- Switzerland; Volume Viewer-General Electric, USA have been manufactured to improve its diagnostic ability. Providing the deep sense and dimensional perception, the aim of this prospective study is to compare the native 3D (N3D) CT images with 2 anaglyph images by using different softwares and delineate their contribution to 3D CT imaging.
Keywords
Computed tomography, Anaglyph method, Radiology.
Introduction
In 1838 Charles Wheatstone alleged that to estimate the relative depths of objects in the world with respect to the fixation point the brain uses horizontal disparity, and described the ‘binocular disparity’ a process known as stereoscopic depth perception or stereopsis [1]. This important principle in vision as technology improved gained a big role in medical imaging techniques especially in anaglyph images. Anaglyph image is a kind of 3D image which is known as a composite picture printed in two colours, typically red and cyan (combination of blue and green). In other words anaglyph 3D images contain two different filtered coloured images for each eye. Nowadays there are several methods to produce 3D vision including stereo photography, anaglyph imaging and stereoscopy [2], where the first anaglyph image was developed in 1852 by Wilhelm Rollmann in Leipzig, Germany [2]. Depending on the filtered colour frequency, when viewed through the colour-coded anaglyph glasses, it reveals an integrated stereoscopic image and proving 3D perception sense by the visual cortex of the brain [3].
In recent years, along with the development of technology, 3D imaging gained an important diagnostic role in CT studies [4-11]. In radiologic routine practice, the 3D computed tomography (CT) examinations are displayed in twodimensional (2D) images. Dimension of images depends on the axis that they have. In 2D images there are two axes (X and Y) while in 3D imaging, there are 3 such as X, Y and also a Z axis [12,13], which represent stereopsis (i.e., depth perception) which is the main visual phenomenon used in the anaglyph methodology [14]. Many studies have been performed regarding 3D visualization using methodologies such as micro vascular surgery technique, endoscopic studies, CT and magnetic resonance imaging (MRI). Rubino et al. emphasized that 3D imaging technique adds a sense of depth and improves the knowledge of distance and orientation of the various anatomical elements, contributing to the study of microsurgical vascular anatomy [3]. In their series, the images were obtained during anterior circulation aneurysm surgery and were posteriorly processed to obtain the 3D effects of anaglyph method. Olivas et al. stated that 3D imaging improves depth perception and spatial orientation of cadaveric endoscopic skull base dissection [14]. In comparison to traditional 3D rendering techniques, Rojas et al. demonstrated the utility of stereoscopic visualization in MRI to provide a perceptual description of the exact location and the relative sizes of various brain landmarks, neural structures and pathologies [15]. They used anaglyph method and also showed that 3D and stereoscopic images improved perception of depth of tumours, relative position of MS pathologies and size of both hippocampi.
Kim et al. [16] studied stereoscopy in CT using two projection methods (summing projection and Maximum Intensity Projection (MIP)) to create a stereoscopy. Anaglyph 3D method was used to offer vivid 3D visualization effect. They stated that summing projection (a method to sum all voxels on the projection plane) stereoscopy was able to show details inside the object, had depth difference in the same components along the pass length and was beneficial for 3D visualization. While MIP (the maximum value in the way of parallel rays) could keep relatively sharp boundary between the object and background, it was not able to represent the objects properly. It had wrong depth information and was not always applicable to create stereoscopy. In a similar study by Smith et al, for displaying 3D structure of the external nose, clinical usage of anaglyph and stereogram images were evaluated [17]. Stereogram and anaglyph images with nasal deformity from stereo images were compared with standard 2D photographs. They found that, the applied methods were reliable, cost effective and easy to use, leading to a detailed demonstration of the nasal structures in terms of aesthetic and reconstructive surgery. It was stated that details of dorsal, tip and alar contour were seen clearly and a significant benefit was determined in terms of operative planning.
In order to improve the diagnostic ability of 3D images, various 3D software programs have been manufactured; Vitrea Workstation-Toshiba, Japan; Synapse 3D-Fujifilm, Japan; OsiriX-Switzerland; Volume Viewer-General Electric, USA. In most of new generation software; Vitrea Workstation, Volume Viewer, Synapse 3D, three dimensional reformat images are displayed as two dimensional traditionally. Although in OsiriX software an anaglyph 3D making option is available, however, it is not sufficient to do diagnosis. Therefore, the development of new techniques of 3D display methods has become a necessity. The aim of this prospective study is to compare the native 3D (N3D) CT images with 2 anaglyph (Photoshop CS5 and InVesalius 3.0) images using different software and assess their contribution to 3D CT imaging.
Equipment and Methods
In order to study and demonstrate 3D deep perception, three methods were used in the study including Native 3D (conventional 3D CT reformat images), 3D images obtained using Photoshop CS5 and InVesalius 3.0 (Centre for Technology and Information “Renato Archer”, Brazil). N3D images were selected as control group, Photoshop-3D and InVesalius-3D images were compared.
Native 3D (N3D): Images of both systems (skeletal and vascular) generated as 3D reformat images, using OsiriX (version 6.0.2; Bernex, Switzerland) workstation.
Photoshop CS5: All 3D reformatted CT images were obtained for each eye as right-sided and left-sided images in Photoshop CS5, by selecting “Channel Mixer” option. Right-sided images were assigned as cyan colour while left-sided images as red colour.
In channel mixer option, all numerical values of the default colours selected as number zero, providing achievement of the desired filtered colour of each eye. “Linear Dodge (Add)” option in the layer menu was selected, using the sliding tool; filtered images were slided up to 5-7 pixels to make 3D anaglyph images. This sliding process enables images to be displayed in 3D vision and depth perception due to new made Z axis by this sliding.
InVesalius 3.0: All DICOM (Digital Imaging and Communications in Medicine) formatted images were imported to the software, selecting “Mid Contrast” and “Anaglyph” options respectively. (Programme is available in: http://svn.softwarepublico.gov.br/trac/invesalius)
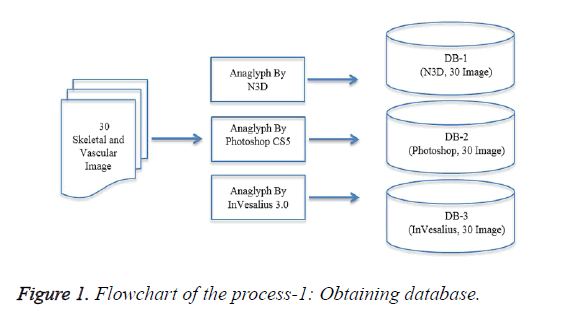
The flowchart of obtaining database processing is shown in Figure 1.
Data collection
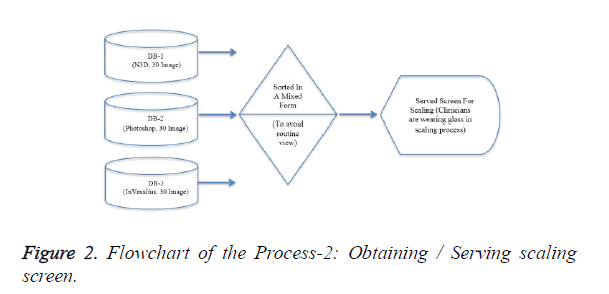
A total of 30 skeletal and vascular systems CT scan were included in this prospective study (Table 1). Of the 30, 15 had pathology (Table 2) and 15 had no remarkable pathologic findings. The images were obtained in 64 multi-detector CT devices (Aquilion 64 Detector CT, Toshiba Medical Systems, Tokyo, Japan.), (CT Protocol: 50 mAs, 120 kV, 5 mm slice thickness; for vascular system studies 350 ml Iodine was used as contrast material). The images were viewed as Native 3D (conventional 2D visualization of 3D volumetric data), Photoshop 3D (Photoshop CS5: Adobe Photoshop CS5 Extended, Version 12.0; Adobe Systems Incorporated, San Jose, California, USA) and InVesalius 3D (InVesalius 3.0: Renato Archer Information Technology centre - CTI, Brazil). Flowchart of image obtaining process is shown in Figure 2. The images were evaluated by 3 radiologists and 3 non-radiologist clinicians blinded to each other. The assessment was performed according to 5 anatomical landmarks for each image (Table 3) and the images were evaluated by the parameters including localization of landmarks, 3D depth perception and noise artefacts.
| Normal Images | Pathologic Images | Total | |||||
|---|---|---|---|---|---|---|---|
| System | Native 3D | Photoshop-3D | InVesalius-3D | Native 3D | Photoshop-3D | InVesalius-3D | |
| Vascular | 5 | 5 | 5 | 5 | 5 | 5 | 30 |
| Skeletal | 5 | 5 | 5 | 5 | 5 | 5 | 30 |
| Total | 10 | 10 | 10 | 10 | 10 | 10 | 60 |
Table 1. Distribution of images according to skeletal and vascular system.
| Pathologies | ||
|---|---|---|
| Vascular System | Skeletal System | |
| 1 | Pulmonary artery aneurysm | Le Fort III Fracture |
| 2 | Thoracic aortic aneurysm | Left clavicula fracture |
| 3 | Aortic dissection (Stanford Type B) | Left caput humeri fracture |
| 4 | Leriche syndrome | Distal radius fracture |
| 5 | Thrombosed External iliac artery | Vertebral fracture |
Table 2. The pathologies were included in the study.
| Anatomical Landmarks | |
|---|---|
| Vascular System | Skeletal System |
| Abdominal aorta | Zygomatic bones |
| Right iliac artery | Supraorbital notches |
| Left iliac artery | Nasal aperture |
| Right internal iliac artery | Mandibular corpus |
| Left internal iliac artery | Patella |
| Superior vena cave | Tibial eminence |
| Right inferior pulmonary vein | Tuberositas tibia |
| Superior pulmonary veins | Lateral condyle of femur |
| Right auricula | Fibula |
| Pulmonary artery root | Coccyx |
| Asendan aorta | Iliac wings |
| Heart | 9-12. Ribs |
| Symphysis pubis | |
| L4 vertebra | |
Table 3. Anatomical landmarks of both systems.
Image evaluation
A total of six observers including 3 radiologists and 3 clinicians other than radiologists (anatomist, ophthalmologist and orthopaedist) evaluated 3D images by using anaglyph glasses (Anaglyph Pro-Ana (TM) Plastic 3D Glasses, American Paper Optics, Tennessee, USA). Observer’s evaluated images in high resolution (1680 x 1050, 22 inches) monitor (Dell P2213, Dell Inc. USA). The eye-monitor distance was 50-60 cm with -10 to -20 degree angle tilt below horizontal eye level for optimum viewing.
Observers were advised to complete the evaluation within 20 minutes. If the evaluation time exceeded, the readers were advised to look distal up to 6 meters for 20 seconds for relaxation and the assessment was completed. In order to prevent complaints such as visual problems, the observers were recommended to change the side of coloured glasses for 20 seconds. No complaints were reported by the observers related with the usage of glasses.
Statistical analysis
Every clinician is asked to scale 30 images tripled by different software developments beyond the three parameters (localization, 3D depth perception, noise artefacts) of five anatomical landmarks in each image were scaled as follows:
• 1 (very poor), 2 (poor), 3 (moderate), 4 (good), 5 (very good) for localization and 3D depth perception
• 0 (none), 1 (poor), 2 (moderate), 3 (high moderate), 4 (severe) for noise artefacts.
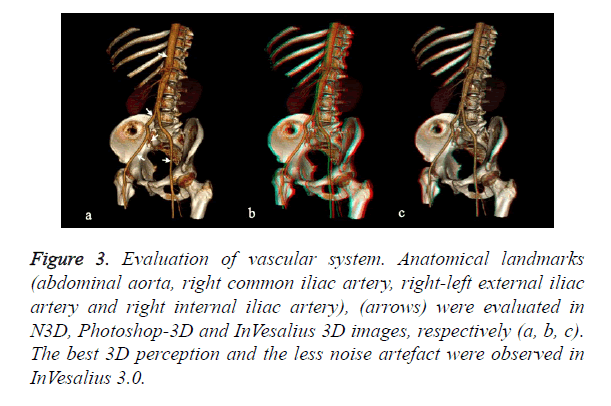
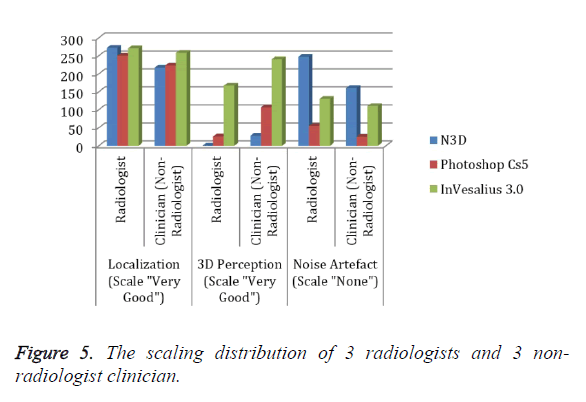
After obtaining vision scales statistical analysis was evaluated by Statistical Package for the Social Sciences (SPSS) statistical software (version 18.0; SPSS Inc., Chicago, IL, USA). Through 95% confidence interval. In comparative analysis for dependent groups, McNemar chi-square analysis was performed. A total 5400 data entry was made. The Figure 3 below is showing the results of databases; localization (in scale “very good”), 3D Perception (in scale “very good”), Noise Artefact (in scale “none”) to N3D, Photoshop CS5 and InVesalius 3.0 respectively. In our study, we preferred anaglyph methodology for 3D visualization, as it is a practical method which needs only simple red-cyan glasses, reliable, more usable and cost-effective compared to other methods. Additionally, anaglyph images can be generated by much available software. In the current study, the participants had no known visual problems such as colour blindness. Because total or partial colour-blindness has a prevalence of 1.3% in population, we believe that it may result in some limitations for viewing in 3D using anaglyph-based methods [18,19]. 3D imaging leads to lower information loss and increase definition of structures. In our study, localization and 3D depth perception of anatomical landmarks were well assessed in both 3D techniques particularly better in InVesalius 3.0. Both radiologist and non-radiologist groups assessed InVesalius 3.0 to be more effective compared to other methods. Although noise artefacts were less noted in radiologist group, it was variable in non-radiologist group. We think that this may be due to the weakness of eye habits in imaging practice of non-radiologist. Additionally a high noise ratio was detected in Photoshop methods. This is due to global sliding of all pixels in Photoshop while selective sliding was performed in InVesalius 3.0, depending on the distance of the structures that provides 3D depth sensation. As it can be seen very clearly DB-1, containing the images retained by N3D got lower scaling grades in every title from clinicians (non-Radiologist) regarding to radiologists. Owing to the systematically pixel sliding algorithm in InVeslius 3.0, providing the Z axis (3D depth sensation), was an expected result in current study. Because, non-radiologist cannot obtain the difference more markedly regarding to radiologists.
Figure 3. Evaluation of vascular system. Anatomical landmarks (abdominal aorta, right common iliac artery, right-left external iliac artery and right internal iliac artery), (arrows) were evaluated in N3D, Photoshop-3D and InVesalius 3D images, respectively (a, b, c). The best 3D perception and the less noise artefact were observed in InVesalius 3.0.
DB-2, containing the images retained by Photoshop CS5 scaled by both groups (radiologist, non-radiologist) as second better solution in localization and 3D perception third at noise artefact.
DB-3, containing the images retained by InVesalius 3.0 got higher scaling grades in every title from clinicians (non- Radiologist) regarding to radiologists except noise artefact scale. This was an unexpected result. The variation in the results of assessment show us that non-detailed evaluation or having little experience in 3D images assessment of non-radiologist, can lead to obtain more different results regarding to radiologists.
Results
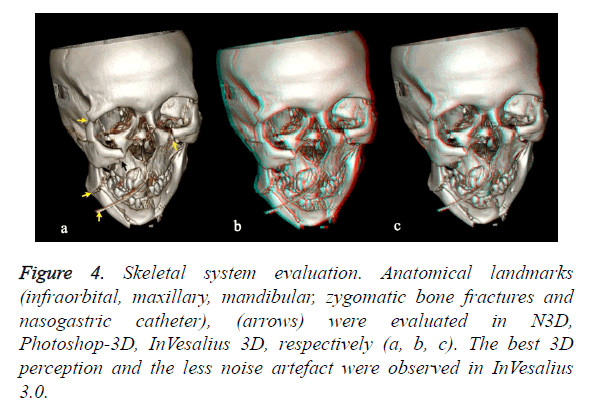
In assessment of 3D depth perception and localization of skeletal system (Figures 3 and 4 and Table 4), N3D was the most useful method in the determination of location by radiologists. In non-radiologist group, InVesalius-3D was the most effective by two observers while N3D was assessed to be successful by one observer (p<0.001). In terms of 3D assessment; two radiologists found InVesalius-3D and one radiologist found Photoshop-3D as successful; in non-radiologist group InVesalius-3D was the superior method (p<0.001) as shown in Figure 5. Regarding to noise parameter, N3D was found to have the lowest noise ratio by radiologists and in non- radiologist group the results were variable. In both groups, determination of 3D depth perception and localization of skeletal system was found to be most successful with InVesalius 3.0 method (p<0.001).
Figure 4. Skeletal system evaluation. Anatomical landmarks (infraorbital, maxillary, mandibular, zygomatic bone fractures and nasogastric catheter), (arrows) were evaluated in N3D, Photoshop-3D, InVesalius 3D, respectively (a, b, c). The best 3D perception and the less noise artefact were observed in InVesalius 3.0.
In the current study, we compared two different software in assessing 3D images. According to the literature, this is the first study which evaluates the depth perception of 3D images. Depending on used methodology, InVesalius 3.0 revealed clearer, real and superior 3D visualization sense, enabling both radiologist and non-radiologist groups identify pathologies more clearly. Although in routine clinical practice, assessment of whether 2D or 3D imaging does not make a remarkable difference for radiologists, 3D displays are highly important in terms of surgical approaches, surgical orientation and planning for surgeons. In our study, the skeletal system details and fractures were noticed more successfully by surgeons (ophthalmologist and orthopaedist) using 3D images particularly those obtained by InVesalius 3.0 compared to 2D display images. In the light of this finding, we think that, depth perception may have an incremental value in planning surgical procedures. Although novelties in 3D visualization methods can improve the utility of imaging data for clinical applications, comprehensive studies are required to show the reliability and validity of these methods.
Conclusion
In our study, we preferred anaglyph methodology for 3D visualization, as it is a practical method which needs only simple red-cyan glasses, reliable, more usable and cost-effective compared to other methods. Additionally, anaglyph images can be generated by much available software. In the current study, the participants had no known visual problems such as colour blindness. Because total or partial colour-blindness has a prevalence of 1.3% in population, we believe that it may result in some limitations for viewing in 3D using anaglyph-based methods [18,19].
3D imaging leads to lower information loss and increase definition of structures. In our study, localization and 3D depth perception of anatomical landmarks were well assessed in both 3D techniques particularly better in InVesalius 3.0. Both radiologist and non-radiologist groups assessed InVesalius 3.0 to be more effective compared to other methods. Although noise artefacts were less noted in radiologist group, it was variable in non-radiologist group. We think that this may be due to the weakness of eye habits in imaging practice of non-radiologist. Additionally a high noise ratio was detected in Photoshop methods. This is due to global sliding of all pixels in Photoshop while selective sliding was performed in InVesalius 3.0, depending on the distance of the structures that provides 3D depth sensation.
In literature, there are some studies performing model evaluation and application using InVesalius programme. Fazanaro et al. developed a methodology and tool for NURBS parameterization, providing the user control over printable physical models by using InVesalius software [20]. Also Rossi et al. studied two methods of Bio-CAD modelling from human edentulous hemi-mandible on the finite element analysis from CT scans of dried human skull reconstructing a stereo lithographic model. They used InVesalius and Mimics (Materialise®, Belgium) software in their study [21].
In the current study [22], we compared two different software in assessing 3D images. According to the literature, this is the first study which evaluates the depth perception of 3D images. Depending on used methodology, InVesalius 3.0 revealed clearer, real and superior 3D visualization sense, enabling both radiologist and non-radiologist groups identify pathologies more clearly. Although in routine clinical practice, assessment of whether 2D or 3D imaging does not make a remarkable difference for radiologists, 3D displays are highly important in terms of surgical approaches, surgical orientation and planning for surgeons. In our study, the skeletal system details and fractures were noticed more successfully by surgeons (ophthalmologist and orthopaedist) using 3D images particularly those obtained by InVesalius 3.0 compared to 2D display images. In the light of this finding, we think that, depth perception may have an incremental value in planning surgical procedures. Although novelties in 3D visualization methods can improve the utility of imaging data for clinical applications, comprehensive studies are required to show the reliability and validity of these methods.
Acknowledgement
We would like to thank Mr. Mahmoud Sasani, for his participation and assisting in preparation of images.
References
- Qian N. Binocular Disparity and the Perception of Depth. Neuron 1997; 18: 359-368.
- Rollmann W. Two new stereoscopic methods Q3. Annalen der Physik 1853; 166: 186-187.
- Rubino PA, Bottan JS, Houssay A, López ES, Bustamante E, Chiarullo M. Three-dimensional imaging as a teaching method in anterior circulation aneurysm surgery. World Neurosurg 2014; 82: 467-474.
- Alder MA, Deahl ST, Matteson SR. Clinical usefulness of two-dimensional reformatted and three-dimensionally rendered computerized tomographic images. J Oral Maxillofac Surg 1995; 53: 375-386.
- M XJ, Tao L, Chen X, Li W, Peng ZY, Chen Y. Clinical application of three-dimensional reconstruction and rapid prototyping technology of multislice spiral computed tomography angiography for the repair of ventricular septal defect of tetralogy of Fallot. Genet Mol Res 2015; 14: 1301-1309.
- Hoevenaren IA, Maal TJJ, Krikken E, de Haan AFJ, Bergé SJ, Ulrich DJO. Development of a three-dimensional hand model using 3D stereo photogrammetry: Evaluation of landmark reproducibility. J Plast Recons Aes Surg 2015; 68: 709-716.
- Sharma S, Gogia V, Garg P, Venkatesh P, Gupta S, Sharma Y. Innovative multiplanar reconstruction and volume-rendered computed tomography in the assessment of scleral buckle-related complications. Retina 2015; 0: 1-6.
- Rodriguez EL, Jimenez RG, Aguilar MS, Anguita JV, Simon JL. Hybrid imaging (SPECT/computed tomography) with three-dimensional reconstruction: a new diagnostic tool for the study of low back pain after spinal fusion surgery. Spine J 2015; 15: 377-378.
- McNamara JR, Fulton GJ, Manning BJ. Three-dimensional computed tomographic reconstruction of the carotid artery: identifying high bifurcation. Eur J Vasc Endovasc Surg 2015; 49: 147-153.
- Xi T, Schreurs R, Heerink WJ, Bergé SJ, Maal TJ. A novel region-growing based semi-automatic segmentation protocol for three-dimensional condylar reconstruction using cone beam computed tomography (CBCT). PLoS One 2014; 9: 111126.
- Akiba T. Utility of three-dimensional computed tomography in general thoracic surgery. Gen Thorac Cardiovasc Surg 2013; 61: 676-684.
- Moon P, Spencer DE. Rectangular Coordinates (x, y, z). Field Theory Handbook, Including Coordinate Systems, Differential Equations, and Their Solutions, Corrected 2nd, 3rd print ed Springer-Verlag New York 1988; 9-11.
- Guichard D. Three dimensions single and multivariable calculus, late transcendental, 2015; 299-328.
- Olivas JA, Cánovas IM, Álvarez BL, García JL, del Campo JS, Albert JRG. Three-dimensional endoscopic endonasal study of skull base anatomy. Neurocirugia 2014; 25: 1-7.
- Rojas GM, Gálvez M, Potler NV, Craddock RC, Margulies DS, Castellanos FX. Stereoscopic three-dimensional visualization applied to multimodal brain images: clinical applications and a functional connectivity atlas. Front Neurosci 2014; 8: 1-14.
- Kim Y, Jang J, Eo T, Hwang D. Comparison study of stereoscopy in computed tomography: Projection versus MIP, Electronics, Information and Communications (ICEIC). Inter Conf 2014; 1: 15-18.
- Smith ME, Lakhani R, Murray P, Leong P. Simple techniques for three-dimensional photography of the nose in nasal deformity. J Vis Comm Med 2012; 35: 50-58.
- Lipton L. Foundations of the Stereo-Scopic Cinema, a Study in Depth, New York. Van Nostrand Reinhold 1982.
- Pokorny J, Smith VC. Eye disease and colour defects. Vision Res 1986; 26: 1573-1584.
- Fazanaro D, Amorim P, Moraes T, Silva J, Pedrini H. Nurbs Parameterization for Medical Surface Reconstruction. Appl Math 2016; 7: 137-144.
- Rossi AC, Freire AR, Botacin PR, Caria PHF, Prado FB. Computer Graphics Applied to Anatomy: A Study of two Bio-CAD Modelling Methods on Finite Element Analysis of Human Edentulous Hemi-Mandible. Int J Morphol 2014; 32: 803-811.
- Sasani H, Kayhan A, Sasani M, Kose S, Celebi ARC, Karatas D, Gokce A, Varol G, Gokbay IZ. Evaluation of three dimensional (3D) reformat computed tomography images in comparison with Photoshop CS5 and InVesalius 3.0 Software. ECR 2016; 0077.
