ISSN: 0970-938X (Print) | 0976-1683 (Electronic)
Biomedical Research
An International Journal of Medical Sciences
Research Article - Biomedical Research (2019) Volume 30, Issue 1
Comparison of different models of insulin resistance in T2DM: A crosssectional study.
Usha Adiga1, Kathyayani P1* and Nandith PB2
1Department of Biochemistry, KSHEMA, Nitte-Deemed to be University, Mangaluru, Karnataka, India
2Central Research Laboratory, KSHEMA, Nitte-Deemed to be University, Mangaluru, Karnataka, India
- *Corresponding Author:
- Kathyayani P
Department of Biochemistry
KSHEMA, Nitte-Deemed to be University
India
Accepted date: February 5, 2019
DOI: 10.35841/biomedicalresearch.30-19-027
Visit for more related articles at Biomedical ResearchIntroduction: Type 2 diabetes mellitus is a metabolic disease characterized by insulin resistance and defective insulin secretion. Quantification of insulin resistance is essential as it may guide treatment options. The aim of the study was to compare HOMA-IR (both insulin and C-peptide based) and QUICKI in type 2 diabetes mellitus patients. Methodology: The cross-sectional study included a hundred and fourteen type 2 DM patients diagnosed as per the American Diabetic Association 2017 guidelines. Fasting blood glucose, insulin and C-peptide were assayed. Insulin resistance and beta cell functioning were calculated by HOMA for insulin and Cpeptide using suitable formulas. Linear regression analysis was done to correlate insulin and C-peptide based HOMA.ROC curves were constructed to compare different insulin sensitivity indices. Results: There was a significant correlation (p=0.007) between insulin and C-peptide based HOMA-IR (r=0.3654. r2=0.1335). Insulin and C-peptide based HOMA1% B also had a significant correlation, p=0.0066 (r=0.2975. r2=0.08850). Insulin and C-peptide based HOMA-B cell also had a significant correlation, p=0.0019 (r=0.3223. r2=0.1039). A linear negative correlation was observed between QUICKI and HOMA-IR (p=0.0001) and HOMA-C (p=0.0004) respectively. ROC curve showed that Cpeptide based HOMA model had the highest area under the curve, 0.836 with better sensitivity and specificity compared to other insulin resistance/sensitivity models. Conclusion: Insulin and C-peptide based HOMA-IR are positively correlated. C-peptide based HOMA is a more sensitive and specific marker of insulin resistance compared to insulin based HOMA-IR and QUICKI.
Keywords
HOMA, QUICKI, Insulin, C-peptide
Introduction
The prevalence of type 2 diabetes has been increasing rapidly resulting in increased morbidity and mortality. Studies suggest that intensification of glycemic control with insulin significantly decreased the risk of diabetic complications over a period of time [1]. Early intensive insulin therapy in newly diagnosed type 2 diabetes mellitus patients might have better recovery and maintenance of β-cell function and longtime diabetic remission [2].
Type 2 diabetes is progressive and that insulin will probably have to be used at some point. Introduction of short-acting insulin has apparently improved postprandial glucose control in type 2 diabetes mellitus.
With the prevalence of type 2 diabetes on the rise and with the recognized need for strict glycemic control in the prevention of complications, strategies for aggressive treatment must be put into effect. Such strategies might include the early use of insulin, alone or in combination with other antidiabetic agents. Several studies have clearly shown that basal insulin therapy, particularly using the insulin analog glargine, closely mimics the body’s physiological secretion of basal insulin and may be added to an existing oral regimen, used alone, or used with preprandial insulin. Decision making regarding therapeutic approach and effectiveness of treatment depends on the measurement of insulin levels and sensitivity of tissues to insulin.
Insulin plays a major role in maintaining glucose homeostasis. Insulin resistance (IR) leads to impaired glucose tolerance and plays an important pathophysiological role in the development of diabetes. Insulin resistance (IR) is established by genetic and environmental factors. It is important to quantify IR as it is a predisposing factor for the development of metabolic syndrome, diabetes mellitus, cardiovascular diseases. Hyperinsulinemic-euglycemic clamp (HEC) is known to be the “gold standard” for the measurement of insulin sensitivity. However, the realization that it is time and money consuming led to the development of a simplified approach in the quantification of insulin sensitivity. Homeostasis model assessment (HOMA) and quantitative insulin sensitivity check index (QUICKI) are two clinically important insulin resistance/sensitivity indices.
HOMA
Homeostatic model assessment (HOMA) is a method used to quantify insulin resistance and beta-cell function from basal (fasting) glucose and insulin or C-peptide concentrations. Simple, minimally invasive predicts fasting steady-state glucose and insulin levels. However, insulin sensitivity in subjects treated with insulin needs further validation. HOMA describes this glucose-insulin homeostasis by means of a set of simple, mathematically-derived nonlinear equations [3,4]. Estimation with the help of the HOMA model parallels equally with that of the euglycemic clamp method [4].
C-peptide, a measure of insulin secretion (not insulin action), can be used in HOMA modeling of both β-cell function and IR. Insulin resistance calculated by the formula, 20/(Fasting C-peptide x FPG) is also a sensitive marker.
QUICKI
It is an empirically derived mathematical transformation of fasting blood glucose and plasma insulin concentrations that provide a consistent and precise insulin sensitivity index with a better positive predictive power [5].
Both HOMA and QUICKI are proved to be clinically important models of quantifying insulin resistance/sensitivity. It is important to quantify IR in diabetics as it may guide in treatment options.
Objectives of our study were to
1. Correlate insulin and C-peptide based homeostatic model assessment for insulin resistance
2. Compare different sensitivity indices like QUICKI and HOMA (both insulin and C-peptide based).
Materials and Methods
Study design
The cross-sectional study was conducted in the Department of Biochemistry, KS Hegde Medical Academy, Mangalore. Institutional ethics committee approval was sought before starting the study. Informed consent was obtained from the subjects.
Inclusion criteria
Subjects: 114 type 2 DM patients (18-65 years), diagnosed as per ADA 2016 guidelines.
Exclusion criteria
Alcoholics, acute and chronic hepatitis, other liver disorders.
Sample collection and analysis
2 ml each of fasting blood sample was collected in fluoride and plain tubes from the antecubital vein, centrifuged at 3000 rpm and plasma was separated. Fasting plasma glucose, insulin, and C-peptide were estimated using fully automated chemistry analyzer, Cobas C-311, and hormone analyzer, Cobas E411, and ELISA respectively.
Insulin resistance was calculated by the homeostasis model assessment (HOMA) (both insulin and C-peptide based) and QUICKI using standard formulae.
Statistical analysis
The data were analysed using Graph Pad Instat version 3.Linear regression analysis was done for the correlation of insulin and C-peptide based HOMA as well as QUICKI. Receiver operator characteristic curves (ROC) were drawn using SPSS version 16 to compare different insulin resistance/sensitivity indices. Insulin-based HOMA-IR was considered as a gold standard to define insulin resistance. HOMA-IR values less than 2.5 were considered normal and more than that were considered as insulin resistant.
Results
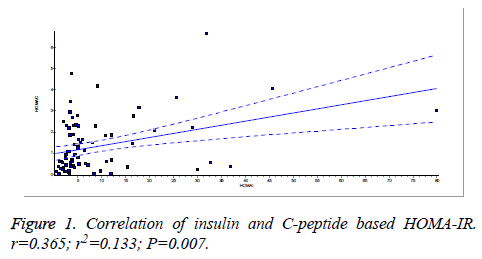
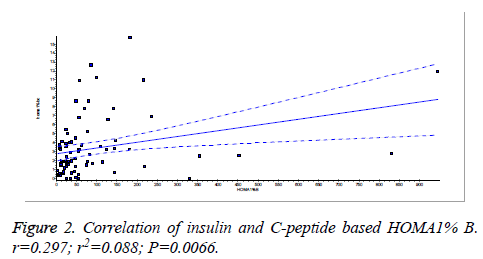
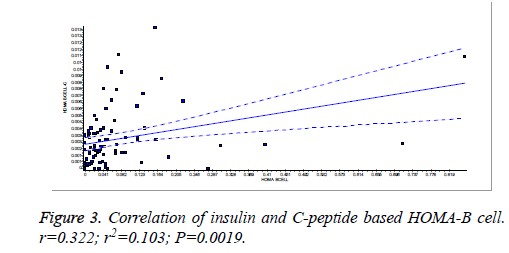
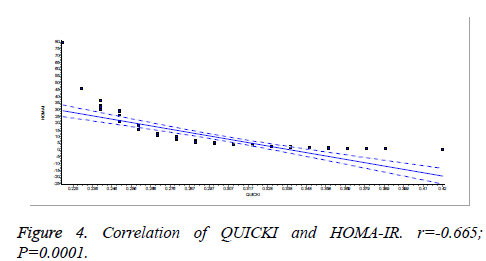
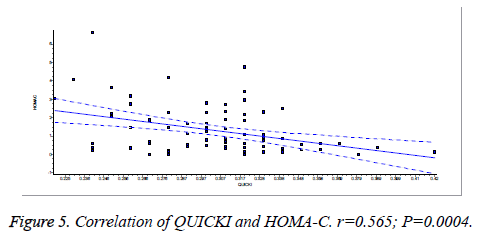
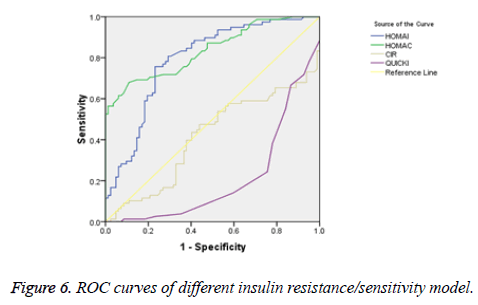
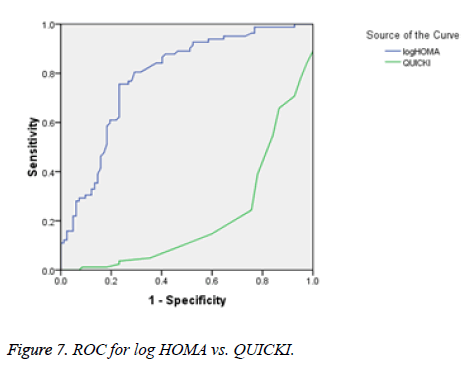
There was a significant positive correlation (p=0.007) between insulin and C-peptide based HOMA-IR (correlation coefficient (r)=0.3654, r2=0.133) (Figure 1). Insulin and C-peptide based HOMA1% B also had a significant positive correlation, (p=0.0066) (correlation coefficient (r)=0.2975. r2=0.08850) (Figure 2). A significant positive correlation was observed between Insulin and C-peptide based HOMA-B cell, (p=0.0019) (correlation coefficient (r)=0.3223. r2=0.1039) (Figure 3). A linear negative correlation was observed between QUICKI and insulin based HOMA-IR (p=0.0001) (Figure 4). A similar finding was observed between C-peptide based HOMA (HOMA-C) (p=0.0004) (Figure 5). ROC curve showed that C-peptide based HOMA model had the highest area under the curve, 0.836 with better sensitivity and specificity compared to other insulin resistance/sensitivity models (Figures 6 and 7). ROC curves for log HOMA (insulin based ) and QUICKI revealed that log HOMA is a better model to quantify IR compared to QUICKI with higher AUC (0.787 vs. 0.214).
Discussion
A significant positive correlation between insulin and C-peptide based HOMA models suggest that C-peptide may be used as an alternative marker to quantify insulin resistance (Figures 1-3). However, ROC studies showed that C-peptide based HOMA-IR had the highest AUC (Figure 6 and Table 1) suggesting that C-peptide based insulin resistance models are superior to that based on insulin. As the normal values for HOMA-IR (insulin based) and QUICKI are well established (<2.5 and 0.382 ± 0.0007), it has been easy to use these indices. As the number of studies on C-peptide based insulin resistance is limited, reference ranges for these are yet to be established.
| Insulin resistance models | Area under the curve (AUC) | Sensitivity | Specificity |
|---|---|---|---|
| HOMA-IR | 0.79 | 98.70% | 80.50% |
| HOMA-C | 0.836 | 98.70% | 91.50% |
| CIR | 0.414 | 50% | 52.40% |
| QUICKI | 0.211 | 35.50% | 6.40% |
Table 1: AUC, sensitivity, and specificity for different insulin resistance models.
Our findings are in accordance with the study by Kim et al., which suggested a higher area under curve (AUC) for C-peptide based IR models [6]. Fasting C-peptide × fasting glucose was better associated with insulin resistance measured as hyperinsulinemic-euglycemic clamps than HOMA-IR [7]. Meier et al. reported that C-peptide-based index was more closely correlated than an insulin-based index with β-cell mass [8]. Loopstra-Masters et al. report that proinsulin-to-C-peptide ratio was the stronger predictor of diabetes in comparison with proinsulin-to-insulin ratios [9].
C-peptide is may be better index compared to insulin based IR models. C-peptide doesn’t undergo hepatic extraction, so C-peptide may more accurately reflect pre-hepatic β-cell secretion. Pre-hepatic β-cell insulin secretion can be estimated by plasma C-peptide level [10,11]. C-peptides have more steady clearance than insulin [10]. C-peptide has lower within the subject and between-subject variation than insulin, so C-peptides were more reproducible for the determination of β-cell function [12,13]. C-peptide has the insulinomimetic effect and may also interact synergistically with insulin by disaggregating hexameric insulin into active monomeric form [14,15].
A significant negative linear relationship between QUICKI and both the HOMA models suggest that lower the QUICKI more is the insulin resistance (Figures 4 and 5). ROC analysis shows that log HOMA represents insulin resistance better than QUICKI (Figure 7 and Table 2).
| Insulin resistance models | Area under the curve (AUC) | Sensitivity | Specificity |
|---|---|---|---|
| Log HOMA | 0.787 | 35% | 7% |
| QUICKI | 0.211 | 35.50% | 6.40% |
Table 2: AUC, sensitivity, and specificity for log HOMA and QUICKI.
Conclusion
Insulin and C-peptide based HOMA-IR are positively correlated. C-peptide based HOMA-IR is sensitive (98.7%) and more specific marker (91.5%) of insulin resistance compared to insulin based HOMA-IR (98.7% and 80.5% respectively).
Acknowledgement
Sincere thanks to Dr. Sukanya Shetty, HOD Biochemistry for support.
Financial Support
Funded partly by Nitte-Deemed to be University and Research Society for Study of Diabetes in India (RSSDI).
References
- UK Prospective Diabetes Study (UKPDS) Group. Intensive blood-glucose control with sulphonylureas or insulin compared with conventional treatment and risk of complications in patients with type 2 diabetes (UKPDS 33). Lancet 1998; 352: 837-853.
- Weng J, Li Y, Xu W, Shi L, Zhang Q, Zhu D. Effect of intensive insulin therapy on beta-cell function and glycaemic control in patients with newly diagnosed type 2 diabetes: a multicentre randomised parallel-group trial. Lancet 2008; 371: 1753-1760.
- Haffner M, Miettinen H, Stern P. The homeostasis model in the San Antonio Heart Study. Diabetes Care 1997; 20: 1087-1092.
- Wallace M, Levy C, Matthews R. Use and abuse of HOMA modeling. Diabetes Care 2004; 27: 1487-1495.
- Chen H, Sullivan G, Quon J. Assessing the predictive accuracy of QUICKI as a surrogate index for insulin sensitivity using a calibration model. Diabetes 2005; 54: 1914-1925.
- Jong-Dai K, Sung Ju K, Min Kyung L, Se Eun P, Eun Jung R, Cheol-Young, Ki-Won O, Sung-Woo P, Won-Young L. C-Peptide-based index is more related to incident type 2 diabetes in non-diabetic subjects than insulin-based index. Endocrinol Metab 2016; 31: 320-327.
- Ohkura T, Shiochi H, Fujioka Y, Sumi K, Yamamoto N, Matsuzawa K. 20/(fasting C-peptide × fasting plasma glucose) is a simple and effective index of insulin resistance in patients with type 2 diabetes mellitus: a preliminary report. Cardiovasc Diabetol 2013; 12: 21.
- Meier J, Menge A, Breuer G, Muller A, Tannapfel A, Uhl W. Functional assessment of pancreatic beta-cell area in humans. Diabetes 2009; 58: 1595-1603.
- Loopstra-Masters C, Haffner M, Lorenzo C, Wagenknecht E, Hanley J. Proinsulin-to-C-peptide ratio versus proinsulin-to-insulin ratio in the prediction of incident diabetes: the insulin resistance atherosclerosis study (IRAS). Diabetologia 2011; 54: 3047-3054.
- Van Cauter E, Mestrez F, Sturis J, Polonsky S. Estimation of insulin secretion rates from C-peptide levels. Comparison of individual and standard kinetic parameters for C-peptide clearance. Diabetes 1992; 41: 368-377.
- Breda E, Cobelli C. Insulin secretion rate during glucose stimuli: alternative analyses of C-peptide data. Ann Biomed Eng 2001; 29: 692-700.
- Gottsater A, Landin-Olsson M, Fernlund P, Gullberg B, Lernmark A, Sundkvist G. Pancreatic beta-cell function evaluated by intravenous glucose and glucagon stimulation. A comparison between insulin and C-peptide to measure insulin secretion. Scand J Clin Lab Invest 1992; 52: 631-639.
- Utzschneider M, Prigeon L, Tong J, Gerchman F, Carr B, Zraika S. Within-subject variability of measures of beta cell function derived from a 2 h OGTT: implications for research studies. Diabetologia 2007; 50: 2516-2525.
- Grunberger G, Qiang X, Li Z, Mathews T, Sbrissa D, Shisheva A. Molecular basis for the insulinomimetic effects of C-peptide. Diabetologia 2001; 44: 1247-1257.
- Kubota M, Sato Y, Khookhor O, Ekberg K, Chibalin V, Wahren J. Enhanced insulin action following subcutaneous co-administration of insulin and C-peptide in rats. Diabetes Metab Res Rev 2014; 30: 124-131.
