ISSN: 0970-938X (Print) | 0976-1683 (Electronic)
Biomedical Research
An International Journal of Medical Sciences
Research Article - Biomedical Research (2017) Volume 28, Issue 10
Correlations of total cholesterol content of erythrocyte membranes with plasma cholesterol efflux capacity
Mengzuo Wu1, Jianhua Zhang1,2, Yan Xu1*, Yueguo Wang1, Fengfeng Deng1 and Xuhua Chen1
1Department of Cardiology, the First Affiliated Hospital of Anhui Medical University, Hefei, PR China
2Department of Cardiology, the First Affiliated Hospital of Jinan University, Guangzhou, PR China
- *Corresponding Author:
- Yan Xu
Department of Cardiology
The First Affiliated Hospital of Anhui Medical University, PR China
Accepted date: February 7, 2017
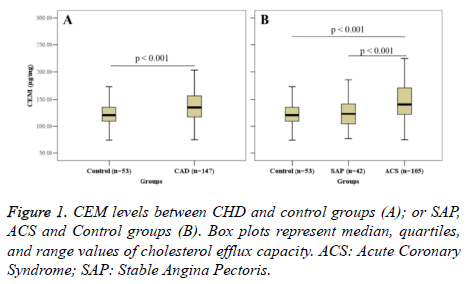
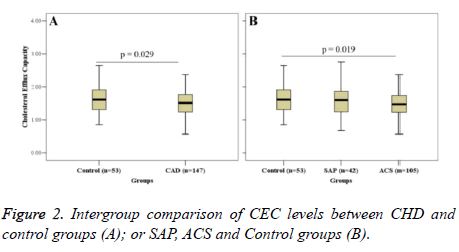
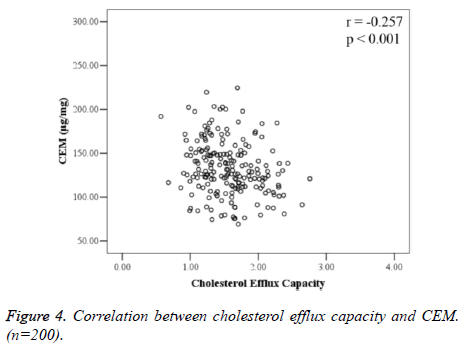
The study aimed to detect the total cholesterol Content of Erythrocyte Membranes (CEM) and plasma Cholesterol Efflux Capacity (CEC), and to analyse its correlations with Acute Coronary Syndrome (ACS), in attempt to explore the possible causes of increasing CEM in patients. One hundred and fortyseven patients with Coronary Heart Disease (CHD) were enrolled, while 53 subjects with normal coronary arteriography served as the control group. CEM, CEC, and conventional blood lipid parameters were detected. CEM in the CHD group (138.63 ± 34.92 μg/mg) was significantly higher than the control group (121.29 ± 24.04 μg/mg) (P<0.001). Further analysis revealed that CEM in ACS patients was significantly higher than that in the SAP (Stable Angina Pectoris) group (P<0.001). CEC in the CHD group (1.53 ± 0.40) was significantly lower than the control group (1.67 ± 0.47) (P=0.029). CEC and CEM showed a significant negative correlation (r=-0.257, P<0.001), suggesting that the reduction of CEC might result in an increase in CEM in ACS patients.
Keywords
Total cholesterol content of erythrocyte membranes, Plasma cholesterol efflux capacity, Coronary heart disease, Acute coronary syndrome, ApoA-I
Introduction
Acute Coronary Syndrome (ACS) constitutes a group of clinical symptoms that are a serious threat to human health. ACS is commonly characterized by acute myocardial ischemia. Moreover, unstable coronary atherosclerotic plaques are a basic pathophysiological feature of the syndrome.
Studies have shown that plaques with a lipid core proportion greater than 40% are prone to rupture, and are known as vulnerable plaques [1]. The lipid core in vulnerable plaques is rich in free cholesterol, and contains up to 63% of Total cholesterol (T-ch) [2]. Initially, it was generally accepted that free cholesterol inside the lipid core was derived from apoptotic macrophages. However, studies of the pathological process of Coronary Heart Disease (CHD) showed that Red Blood Cells (RBCs) may also be an important source of free cholesterol in atherosclerotic plaques. Pasterkamp and Virmani [1] found that the blood group antigen A was only expressed on RBC membranes, suggesting that RBCs could enter the plaques. Tziakas et al. [3] proposed that a strong correlation exists between Content of Erythrocyte Membranes (CEM) and ACS, independent from other clinical and risk factors. The study proposed that increased CEM could reflect unstable plaques in CHD patients.
Moreover, our previous studies showed that CHD patients exhibited significantly increased CEM compared to the control group, and the CEM in patients with ACS was significantly higher than that in the patients with stable angina [4,5]. These results suggest that CEM might serve as a reflective index for the unstable plaques in CHD patients; however, the exact cause of CEM elevation remains unclear.
Cholesterol metabolism in peripheral tissue cells is governed by High-Density Lipoprotein-Cholesterol (HDL-C) Reverse Cholesterol Transportation (RCT). Furthermore, HDL-C transports excessive cholesterol in peripheral tissues back to the liver for metabolism [6,7]. Previous large-sample epidemiological studies suggested that plasma HDL-C level was significantly negatively correlated with the occurrence of HCD [8,9]. The NCEP ATP-III guidelines, published in 2001 recommended that treatment goals of Low Protein Lipoprotein Cholesterol (LDL-C) be set in CHD patients to increase the HDL-C level [10]. However, in recent years, a variety of clinical practices have tried to increase plasma HDL-C concentrations without any promising clinical results [11-13]. Therefore, using HDL-C levels as an index to evaluate the risk of CHD has certain limitations and may not fully reflect the functions of HDL-C [14]. Khera et al. [15] measured Cholesterol Efflux Capacity (CEC) of serum HDL-C in CHD patients for the first time. They found that CEC was negatively correlated with the medial layer thickness of carotid arterial intima and incidence of CHD, proposing that the CEC was the best index to evaluate the HDL functions. Furthermore, Bhatt and Rohatgi [16] suggested that CEC might be a new target for CHD treatment. We detected plasma CEC in CHD patients [17], which was significantly reduced compared with the control group, and found that CEC showed no significant correlation with HDL-C. CEC reflects the RCT function promoted by HDL-C in peripheral tissue cells. But whether cholesterol in RBC is metabolized via the RCT pathway remains unclear. Previous studies [4,5] found that CEM showed no significant correlation with the serum HDL-C level; however, the correlation between CEM and CEC remains to be studied.
The transport mechanism of CEM is unclear, and our previous studies revealed that the Apolipoprotein A-I (ApoA-I) content had certain negative correlations with CEM [4]. ApoA-I is an important initial factor that could mediate RCT; therefore, we speculate that the reduction of CEC could result in elevated CEM in CHD patients. This study detected CEC and CEM in CHD patients, and performed a correlation analysis to explore the possible reasons underlying an elevation in CEM as well as the pathophysiological basis of CHD.
Subjects and Methods
Subjects
One hundred and forty-seven patients admitted to the Department of Cardiology of the First Affiliated Hospital of Anhui Medical University, from December 2012 to December 2013 due to chest pain or oppression, and diagnosed with CHD according to the results of coronary angiography were selected (42 patients with unstable angina and 105 with ACS). In addition, 53 age- and sex-matched patients with atypical chest pain, and cleared of CHD by coronary angiography were selected and set as the control group. This study was conducted in accordance with the declaration of Helsinki. This study was conducted with approval from the Ethics Committee of Anhui Medical University. Written informed consent was obtained from all participants. The exclusion criteria were patients previously diagnosed with CHD; with chronic blood diseases; with excessive drinking history; with chronic hepatonephric dysfunction and thyroid diseases; with autoimmune diseases; with familial hyperlipidemia; with acute infectious diseases; underwent surgery or with history of trauma within 3 months; with abnormal RBC count (M: <4.0 or >5.5 × 10¹²/L; F: <3.5 or >5.0 × 10¹²/L) or abnormal haemoglobin (M: <120 g/L female; or>160 g/L: <110 g/L or >150 g/L); being administered with anti-inflammatory drugs or hormone replacement therapy; with malignant cancers; previously, or presently being administered with lipid-lowering drugs.
Detection of CEM
Detection of CEM was carried out by referring to our previous studies [4,5]. Heparin-anticoagulant fasting blood sample was collected (5 ml) and centrifuged at 4°C and 3000 rev/min for 10 min to precipitate the erythrocytes. The lower-layer red blood cell suspension was added with 3-time isotonic NaCl solution, washed, and centrifuged 3 times to separate RBCs. After centrifugation at 4°C and 15000 g/min for 15 min, and repeated washing and centrifugation, the white RBC membrane sample was obtained. The Lowry assay was used to detect the concentrations of RBC membrane proteins. The RBC membrane lipids were extracted using the Folch procedure and stored at -80°C. Thereafter, CEM was detected using the enzymatic method with the ROCHE Modular DPP automatic biochemical analyser (Roche, Swiss) in the biochemical lab of the First Affiliated Hospital of Anhui Medical University. CEM was expressed using the RBC membrane cholesterol/ membrane protein concentration.
Detection of CEC
Referring to Rothblat [18], the Apolipoprotein (ApoB)-free plasma was prepared by adding PEG8000 (Sangon Biotech, PR China). Thereafter, CEC was detected referring to our previous study [17]. The J774 cells were seeded into 24-well cell culture plates, followed by thermostatic incubation for 18 h; after the cells fused and formed layers. The cell culture medium was aspirated and 0.5 ml of 2 μCi/ml (1, 2-3 H) cholesterol (Perkin Elmer, Fremont, USA) was then added into each well; the tritiated cholesterol was then labelled into the J774 cells, and following 24 h cultivation, the cells were rinsed twice with PBS twice at room temperature. Thereafter, 0.5 ml of 0.3 mmol/ml cAMP (Sigma-Aldrich, San Francisco, USA) upregulation solution was then added into each well, followed by thermostatic incubation for 16 hours. After washing with MEM-BSA and MEM, each well of the cell culture plates was added with 0.5 ml of pre-formulated 2% standard serumcontaining MEM-HEPES medium, 2.8% sample serumcontaining MEM-HEPES, or serum-free MEM-HEPES for 4 h cultivation. Thereafter, liquid scintillation counting was performed to measure the radioactive cholesterol in the cells and outflow into the medium. The outflow percentage was calculated using the following equation: tritiated cholesterol in the medium/(tritiated cholesterol in the medium+cells) × 100%. Statistical HCEC was calculated using the calibrated HDL-CEC, namely the ratio of the serum cholesterol efflux percentage in the sample to the standard serum cholesterol efflux percentage (unit: 1) so as to reduce the intergroup difference. To correct for inter assay variation across plates, a pooled serum control from 5 healthy volunteers was included on each plate, and the values of the serum samples from patients were normalized to this pooled value in subsequent analysis. Each serum sample was tested three times.
Detection of conventional blood lipids
Triglyceride (TG), T-ch, LDL-C, HDL-C, ApoA-I, and ApoB were detected using standard methods using the ROCHE Modular DPP automatic biochemical analyser (Roche, Swiss), in the biochemical lab of the first Affiliated hospital of Anhui Medical University.
Statistical analysis
Normally distributed measurement data were expressed as mean ± standard deviation, whereas data with skewed distribution were expressed as median and interquartile range. The count data were expressed as a percentage. SPSS13.0 was used for data analysis, with P<0.05 considered as significantly different. Normality tests were performed for all the statistical indicators. The intergroup comparison of count data was carried out using the chi-square test. Choice of statistical comparison of the measurement data was based on their properties. If the data was normally distribution, the intergroup averages were compared using the two-sample t-test. Comparison of 3 groups was carried out using the one-way analysis of variance test. If the data were not normally distributed, the intergroup averages were compared using the Wilcoxon rank-sum test. The correlation analysis among indicators was carried out using the multiple linear regression model.
Results
Comparison of clinical data among the patients
The clinical data of all patients are shown in Table 1. The clinical baseline data and general blood lipid indicators of the CHD and control groups showed no statistically significant differences.
| Variables | CAD (n=147) | Control (n=53) | p value |
|---|---|---|---|
| Age, years | 63 ± 10 | 61 ± 11 | 0.167 |
| Men | 69% | 58% | 0.15 |
| Hypertension | 54% | 68% | 0.073 |
| Diabetes mellitus | 16% | 13% | 0.67 |
| Current smoker | 49% | 36% | 0.1 |
| T-ch, mmol/L | 4.44 ± 1.26 | 4.55 ± 1.01 | 0.582 |
| TG, mmol/L | 1.42 (0.93-2.11) | 1.46 (1.04-1.96) | 0.91 |
| HDL-C, mmol/L | 1.12 (0.87-1.39) | 1.46 (0.97-1.36) | 0.382 |
| LDL-C, mmol/L | 2.61 ± 0.41 | 2.70 ± 0.91 | 0.628 |
| ApoA-I, mg/L | 1.18 ± 0.31 | 1.24 ± 0.30 | 0.263 |
| ApoB, mg/L | 0.82 (0.69-0.92) | 0.78 (0.65-0.92) | 0.564 |
Table 1. Comparison of clinical data in patients with CAD and Control groups. (n=200).
Intergroup comparison of CEM
Figure 1 shows the intergroup comparison of CEM. CEM in the CHD group (138.63 ± 34.92 μg/mg) was significantly higher than that in the control group (121.29 ± 24.04 μg/mg) (P<0.001) (Figure 1A). Further analysis revealed that CEM in the ACS group was significantly higher than that in the SAP group (122.98 ± 25.76) (P<0.001); however, no significant difference in CEM was found between the SAP group and the control group (Figure 1B).
Intergroup comparison of CEC
Figure 2 shows the intergroup comparison of CEC. CEC in the CHD group (1.53 ± 0.40) was significantly lower than that in the control group (1.67 ± 0.47) (P=0.029) (Figure 2A). Further analysis revealed that CEC in the ACS group (1.51 ± 0.38) was significantly higher than that in the control group (P=0.019); CEC in the SAP group (1.51 ± 0.43) was lower than that in the control group; but there was no significant difference (Figure 2B).
Correlations between CEM and conventional blood lipid indices
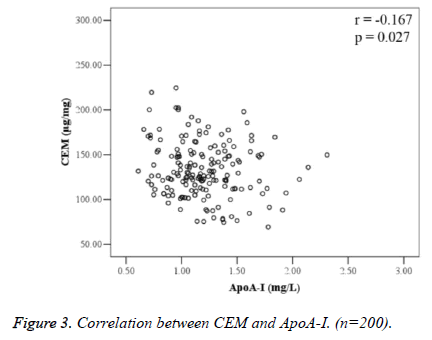
Correlation analysis between CEM and blood lipid indices is shown in Table 2. There was no correlation between CEM and serum T-ch, TG, LDL-C, HDL-C, and ApoB; CEM was negatively correlated with ApoA-I (r=-0.167, P=0.027) (Figure 3).
| Blood lipid index | r | p |
|---|---|---|
| T-ch, mmol/L | -0.1 | 0.177 |
| TG, mmol/L | -0.043 | 0.558 |
| LDL-C, mmol/L | -0.062 | 0.412 |
| HDL-C, mmol/L | -0.13 | 0.083 |
| ApoB, mg/L | -0.094 | 0.213 |
| ApoA-I, mg/L | -0.167 | 0.027 |
Table 2. Correlation between CEM and serum lipids. (n=200).
Correlation analysis of CEC with CEM
CEM and CEC were negatively correlated (r=-0.257, P<0.001), and the difference was statistically significant (Figure 4).
Discussion
The results of this study revealed that: (1) CEM in CHD patients was significantly higher than that in the control group, and CEM in patients with ACS was significantly higher than that in the SAP group. (2) CEC in patients with CHD was significantly lower than that in the control group. Further analysis revealed that CEC in patients with ACS was significantly lower than that in the control group. Moreover, CEC in the SAP group exhibited a declining trend compared to the control; however, this difference was not statistically significant. (3) CEC and CEM were significantly negatively correlated. (4) The correlation analysis between CEM and general blood lipid indices revealed that CEM was negatively correlated with ApoA-I.
The rupture of an atherosclerotic plaque is considered important in initiating ACS [19]. Recent studies have indicated that blood vessel formation and intra-plaque hemorrhage play essential roles in the occurrence and development process of atherosclerotic plaque instability [20,21]. New blood vessels are often nourished through the outer membrane, have indiscriminate branches and immature endothelial conduits, and are also prone to leaking.
This immature vasculature may be a cause of intraplaque hemorrhage [19]. Once an intraplaque hemorrhage occurs, the RBCs accumulate within the plaques, followed by phagocytosis and decomposition by the macrophages, which results in the cholesterol and phospholipids of the RBC membranes being released [22]. The cholesterol accumulation inside the plaques leads to the lipid core increasing, thus promoting the instability of plaques. The aforementioned studies suggested that RBCs, especially erythrocyte membrane lipids, might be involved in the pathogenesis of ACS and severe CHD. Tziakas et al. [3] reported CEM was related with the pathogenesis of ACS, and independent from other risk factors and clinical characteristics; therefore, the increase in CEM was considered a marker to reflect the plaque instability in ACS instead of reflecting atherosclerosis. It has also been speculated that CEM might serve as a marker of atherosclerotic plaque vulnerability. Our previous studies also confirmed that the elevated CEM was independently correlated with ACS [4,5]. A similar conclusion was reached in this study, which indicates that increasing CEM may have an important role in the progression of atherosclerotic plaque instability.
RCT results in the movement of cholesterol from the peripheral tissues or cells into the liver for metabolism. In addition, RCT is very important in protecting against atherosclerotic diseases [23]. One key step in RCT is cholesterol efflux from macrophages; therefore, CEC has important protective roles against atherosclerosis [24]. A series of experimental studies using genetically modified mice [25] revealed that macrophage-specific cholesterol efflux and RCT were significantly negatively correlated with the size of atherosclerotic plaques, and exhibited more predictive values than HDL.
Our previous study [17] showed that CEC in patients with CHD was significantly reduced compared with that in the control group, which is consistent with the findings of Khera et al. [15] and Li et al., [26] whose studies of the cross sections in CHD patients revealed that CEC was negatively correlated with the occurrence of CHD. The present study again showed that CEC in patients with CHD was reduced compared with that in the control group.
The transport mechanism of CEM is still unclear. However, our previous study showed that the ApoA-I content was negatively correlated with CEM [4], which is similar to results obtained in the present study. Our findings further showed that CEC was significantly negatively correlated with CEM, but was not correlated with HDL-C content. RCT is a cholesterol transportation and metabolism process that consists of a variety of biologically active molecules, during which HDL-C is successively transformed from new-born pre-β1 HDL to mature α-HDL. In addition, the mutual conversion and metabolism of different HDL subclasses plays important roles in RCT [27].
Throughout RCT, the gradual metabolism of HDL-C was pre- β1 HDL → pre-β2 HDL → HDL 3 → HDL2. Therefore, the serum CEC level can be viewed as the index reflecting the overall functional activities of HDL subclasses during RCT, which in turn provides greater practical meaning compared to single HDL-C concentration (HDL content). The results of this study suggest that the CEC reduction in patients with CHD might the cause of increasing CEM. The finding is useful as it provides an alternative direction for future studies of causes of increasing CEM in patients with ACS.
This study has some limitations. First, this was a single-center study, and the sample size was limited. Therefore, the reliability of the results requires confirmation by studies using a larger sample size. Second, although this study showed that CEC reduction might be the cause CEM increase in patients with CHD. While this result was obtained by correlation analysis, we believe further studies are warranted, which are being carried out by our group. In addition, whether an elevation CEM in might exhibit certain changes, such as a change of its deformation abilities, still require further studies.
Acknowledgment
This work was supported by Project Founded by China Postdoctoral Science Foundation (2014M552273), the Anhui Provincial Science and Technology Projects (number: 09010302083), National High Technology Research and Development Program for Young Scientists of China (2014AA020534).
Conflicts of Interest
All of the authors declare that they have no conflicts of interest regarding this paper.
References
- Pasterkamp G, Virmani R. The erythrocyte: a new player in atheromatous core formation. Heart 2002; 88: 115-116.
- Guyton JR, Klemp KF. Development of the atherosclerotic core region. Chemical and ultrastructural analysis of microdissected atherosclerotic lesions from human aorta. Arterioscler Thromb 1994; 14: 1305-1314.
- Tziakas DN, Kaski JC, Chalikias GK, Romero C, Fredericks S, Tentes IK, Kortsaris AX, Hatseras DI, Holt DW. Total cholesterol content of erythrocyte membranes is increased in patients with acute coronary syndrome: a new marker of clinical instability? J Am Coll Cardiol 2007; 49: 2081-2089.
- Zhang J, Pan L, Xu Y, Wu C, Wang C, Cheng Z, Zhao R. Total cholesterol content of erythrocyte membranes in acute coronary syndrome: correlation with apolipoprotein A-I and lipoprotein (a). Coron Artery Dis 2011; 22: 145-152.
- Zhang J, Tu K, Xu Y, Pan L, Wu C, Chen X, Wu M, Cheng Z, Chen B. Sphingomyelin in erythrocyte membranes increases the total cholesterol content of erythrocyte membranes in patients with acute coronary syndrome. Coron Artery Dis 2013; 24: 361-367.
- Assmann G, Gotto AM. HDL cholesterol and protective factors in atherosclerosis. Circulation 2004; 109: 8-14.
- Toth PP. High-density lipoprotein and cardiovascular risk. Circulation 2004; 109: 1809-1812.
- Barter P, Gotto AM, LaRosa JC, Maroni J, Szarek M. HDL cholesterol, very low levels of LDL cholesterol, and cardiovascular events. N Engl J Med 2007; 357: 1301-1310.
- Huxley RR, Barzi F, Lam TH, Czernichow S, Fang X, Welborn T, Shaw J, Ueshima H, Zimmet P, Jee SH, Patel JV, Caterson I, Perkovic V, Woodward M. Isolated low levels of high-density lipoprotein cholesterol are associated with an increased risk of coronary heart disease: an individual participant data meta-analysis of 23 studies in the Asia-Pacific region. Circulation 2011; 124: 2056-2064.
- Executive Summary of the Third Report of the National Cholesterol Education Program (NCEP) Expert Panel on Detection, Evaluation, and Treatment of High Blood Cholesterol in Adults (Adult Treatment Panel III). JAMA 2001; 285: 2486-2497.
- Barter PJ, Caulfield M, Eriksson M, Grundy SM, Kastelein JJ. Effects of torcetrapib in patients at high risk for coronary events. N Engl J Med 2007; 357: 2109-2122.
- Boden WE, Probstfield JL, Anderson T, Chaitman BR, Desvignes-Nickens P, Koprowicz K, McBride R, Teo K, Weintraub W. Niacin in patients with low HDL cholesterol levels receiving intensive statin therapy. N Engl J Med 2011; 365: 2255-2267.
- Landray MJ, Haynes R, Hopewell JC, Parish S, Aung T, Tomson J, Wallendszus K, Craig M, Jiang L, Collins R, Armitage J. Effects of extended-release niacin with laropiprant in high-risk patients. N Engl J Med 2014; 371: 203-212.
- Guey LT, Pullinger CR, Ishida BY, OConnor PM, Zellner C, Francone OL, Laramie JM, Naya-Vigne JM, Siradze KA, Deedwania P, Redberg RF, Frost PH, Seymour AB, Kane JP, Malloy MJ. Relation of increased prebeta-1 high-density lipoprotein levels to risk of coronary heart disease. Am J Cardiol 2011; 108: 360-366.
- Khera AV, Cuchel M, de la Llera-Moya M, Rodrigues A, Burke MF, Jafri K, French BC, Phillips JA, Mucksavage ML, Wilensky RL, Mohler ER, Rothblat GH, Rader DJ. Cholesterol efflux capacity, high-density lipoprotein function, and atherosclerosis. N Engl J Med 2011; 364: 127-135.
- Bhatt A, Rohatgi A. HDL cholesterol efflux capacity: cardiovascular risk factor and potential therapeutic target. Curr Atheroscler Rep 2016; 18: 2.
- Zhang J, Xu J, Wang J, Wu C, Xu Y. Prognostic usefulness of serum cholesterol efflux capacity in patients with coronary artery disease. Am J Cardiol 2016; 117: 508-514.
- De Llera-Moya M, Drazul-Schrader D, Asztalos BF, Cuchel M, Rader DJ, Rothblat GH. The ability to promote efflux via ABCA1 determines the capacity of serum specimens with similar high-density lipoprotein cholesterol to remove cholesterol from macrophages. Arterioscler Thromb Vasc Biol 2010; 30: 796-801.
- Virmani R, Kolodgie FD, Burke AP, Finn AV, Gold HK, Tulenko TN, Wrenn SP, Narula J. Atherosclerotic plaque progression and vulnerability to rupture: angiogenesis as a source of intraplaque hemorrhage. Arterioscler Thromb Vasc Biol 2005; 25: 2054-2061.
- Kolodgie FD, Gold HK, Burke AP, Fowler DR, Kruth HS. Intraplaque hemorrhage and progression of coronary atheroma. N Engl J Med 2003; 349: 2316-2325.
- Moreno PR, Purushothaman KR, Fuster V, Echeverri D, Truszczynska H, Sharma SK, Badimon JJ, OConnor WN. Plaque neovascularization is increased in ruptured atherosclerotic lesions of human aorta: implications for plaque vulnerability. Circulation 2004; 110: 2032-2038.
- Lin HL, Xu XS, Lu HX, Li CJ, Tang MX, Sun HW, Zhang Y. Pathological mechanisms of erythrocyte-induced vulnerability of atherosclerotic plaques. Med Hypotheses 2008; 70: 105-108.
- Rosenson RS, Brewer HB Jr, Davidson WS, Fayad ZA, Fuster V, Goldstein J, Hellerstein M, Jiang XC, Phillips MC, Rader DJ, Remaley AT, Rothblat GH, Tall AR, Yvan-Charvet L. Cholesterol efflux and atheroprotection: advancing the concept of reverse cholesterol transport. Circulation 2012; 125: 1905-1919.
- Cuchel M, Rader DJ. Macrophages reverse cholesterol transport: key to the regression of atherosclerosis? Circulation 2006; 113: 2548-2555.
- Rader DJ, Alexander ET, Weibel GL, Billheimer J, Rothblat GH. The role of reverse cholesterol transport in animals and humans and relationship to atherosclerosis. J Lipid Res 2009; 50: 189-194.
- Li XM, Tang WH, Mosior MK, Huang Y, Wu Y, Matter W, Gao V, Schmitt D, Didonato JA, Fisher EA, Smith JD, Hazen SL. Paradoxical association of enhanced cholesterol efflux with increased incident cardiovascular risks. Arterioscler Thromb Vasc Biol 2013; 33: 1696-1705.
- Barrans A, Jaspard B, Barbaras R, Chap H, Perret B. Pre-beta HDL: structure and metabolism. Biochim Biophys Acta 1996; 1300: 73-85.


