ISSN: 0970-938X (Print) | 0976-1683 (Electronic)
Biomedical Research
An International Journal of Medical Sciences
Research Article - Biomedical Research (2019) Volume 30, Issue 1
Designing a simple toolbox for the early detection of arrhythmia, using advanced virtual instrumentation.
Ajay Sharma* and Hanuman Prasad Shukla
Department of Electronics Engineering, UCER, Allahabad, India
Accepted date: December 28, 2018
DOI: 10.35841/biomedicalresearch.30-18-1188
Visit for more related articles at Biomedical ResearchAn arrhythmia is a disease in which the heart may beat too fast, too early, too slow or irregular and few may give rise to death or irreparable danger. Atrial fibrillation is one of the most common types of arrhythmia; in this case the heart may race at more than 400 beats per minute. The complications due to atrial fibrillation may lead to cardiomyopathy, haemodynamic instability, strokes or even cardiac failure. The main purpose of this study is to design and develop a simple tool box for the early detection of the atrial fibrillation using the biomedical toolkit of the LabVIEW. As ECG is the conventional method of its detection, but suffers several disadvantages regarding accuracy in diagnosis, but when these vital signals are subjected to the real time analysis on a specially designed LabVIEW based toolbox, the diagnosis accuracy and the correct prediction increases several times. This study will prove to be a great panacea for the cardiac affected patients when the fatal threat to the heart, arrhythmia will be detected at a very early stages.
Keywords
Arrhythmia, Fibrillation, Haemodynamic, Diagnosis, LabVIEW, Panacea
Introduction
With the growth in the world’s population and changing lifestyle of the people, the heart related disease is on the rise [1]. According to the World Health Organization (WHO), the cardiac diseases are one of the world’s biggest predators, claiming 19.3 million lives a year across the world. And this figure is one third of the world’s total population which dies due to any disease [2]. Heart being the most vital organ of our body and a critical one too. So sometimes it is really difficult and complex to develop techniques that can accurately examine its functionality. Electrocardiography is a very basic tool for the analysis of heart diseases that measures and records the electrical activity of our heart by comparing potentials at different places. In case of arrhythmia of the atrial fibrillation type, sometimes it is diagnosed by the traditional ECG method so late that it turns fatal.
Across the world there are continues efforts made for developing different approach and algorithms for the feature extraction of ECG in the minimum time [3], but yet the optimized algorithm is yet to be developed. In this study the author proposes a simple biomedical tool box for the early detection of arrhythmia using a bio medical toolkit of the LabVIEW 8.5. So the basic objective of this research work is to design and develop a much accurate and a faster software algorithm that would help to replace the existing electrocardiograms and would facilitate the cardiac experts to detect and record the basic arrhythmia symptoms simultaneously as early as possible. The algorithm enables the monitoring and recording of heart pulse rate, QRS width, PR interval, RR interval and QT interval, etc. for the early detection of arrhythmia in minimum time.
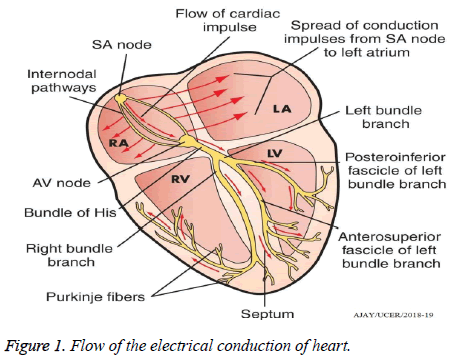
The complete process and flow of the electrical conduction system of the heart is shown by the Figure 1. As we all know that the heart beats of a normal human being starts with a small current that is in the millivolt range. And this small electrical pulse very quickly spreads throughout the heart and makes a complete heartbeat [4].
The SA node commonly known as the Sino Atrial Node is the epicenter, where the electrical wave is initiated and travels towards the AV node. Finally it terminates at the Purkinje fibres [5].
Interpretation of the ECG Signal
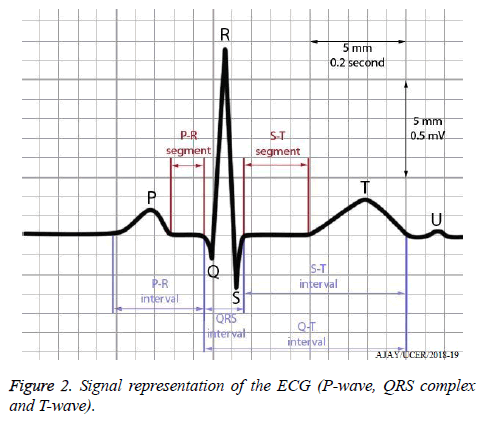
The ECG signal primarily consists of three main segments, first one is the P-wave, second is the QRS complex and the last or the third one is the T wave [6].
All the three components of the electrocardiogram are shown in the Figure 2 in detail, when the blood circulates towards the heart and proceeds in the atrium, known as atrial depolarization, due to which the P wave is formed [7]. After that, the blood moves for ventricular depolarization which causes the formation of QRS complex. And finally, the circulation of the blood undergoes ventricular repolarization in the ventricles causing the formation of the T wave. All the time components of different segments of ECG are clearly shown in the Figure 2. The most important parameter of the ECG is the heart rate which tells us about the number of times our heart is pumping the blood in one minute in the body.
The micro observation of the ECG signal gives us the information that if it is a normal sinus rhythm then we will get the pulse rate somewhere between 58-108 bpm. In this sinus rhythm, presence of any disturbance or any abnormality will be classified as cardiac arrhythmia [8]. Therefore anything above 108 bpm will be known as tachycardia and slower than 58 bpm will be known as bradycardia. And the early discharge of the node differing from the normal sinus will cause the atrial premature condition [9].
In the case of atrial fibrillation the action potential fires very rapidly inside the pulmonary veins or atrium in a very hasty manner, as a result it attains a very fast atrial rate, about 450 to 610 bpm [11]. Since the atrial action potential regularly attempts to conduct through the AV node, but since the AV node becomes intermittently refractory allowing only few atrial action potentials to reach the ventricles. And this is the main reason that in spite of atrial rate reaching 450 to 610 bpm the ventricular rate is still around 110 to 250 bpm.
The atrial fibrillation can further be classified under various following categories such as:- (i) Paroxysmal atrial fibrillation, that occurs for some time and then stops automatically (ii) Persistent atrial fibrillation, that does not stops by itself, but can be corrected. (iii) Long standing persistent atrial fibrillation, that does not stops by itself and cannot be corrected. And based on these types we obtain various type of arrhythmia ECG patterns such as:- atrial fibrillation with normal ventricular rate, atrial fibrillation with bradycardia AND atrial fibrillation with rapid ventricular rate [12,13].
Methods and Material
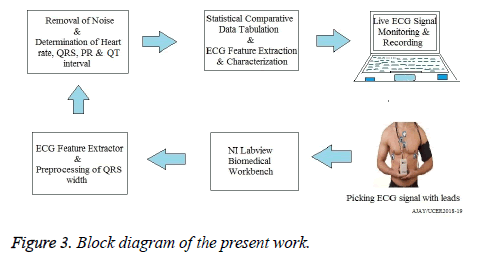
The proposed algorithm and method of this study is as given in the Figure 3, which clearly shows that the author is using an advanced hand held portable ECG recording machine to pick the live signals [14]. As there are number of pharma and electronics giant companies, which are in mass production of portable hand held ECG device, instead of conventional heavy set up of it, which requires trolley or wheels to move it. Brands such as Bionet ECG machine, ChoiceMMed ECG Machines, Welch Allyn ECG, Philips ECG machines, ASPEN ECG Machines, BPL ECG Machines AND GE ECG machine machines are considered to be one of the best ECG machines in Asian Continent.
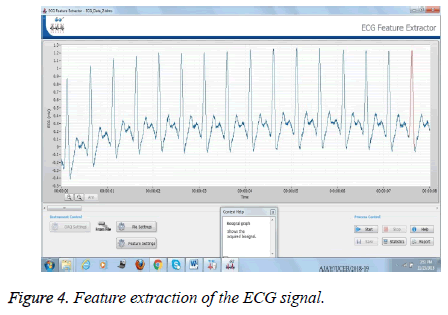
These portable machines are capable of sending the measured data to the receiver wirelessly at 433 MHz FSK/FM transmitter, having the output power of 30 mW at a transmission speed of 3.2 mbps. And this Trans receiver will be interfaced with the Laptop via RS-232 in the VGA port. In case of the mild/feeble ECG signal, the CRO amplifier can be used to amplify/saturate the signals. Now when the live vital signals have reached the NI LabVIEW Bio medical toolkit, the author very first uses the ECG Feature extractor tool and preprocesses the QRS width for finding the initial abnormalities. The raw signal should be preprocessed in order to gather and extract the maximum information bulk from it. Figure 4 shows the snapshot of the process in which the feature extraction and the preprocessing of the signals is being done. Now this signal is passed with Butterworths, bandpass and Gaussian filter for removing noise [15]. In the next stage the determination of the pulse rate (counting of QRS complex in 10 s and then multiplying it by 6 to get in one minute), the duration of PR and QT interval etc. is done.
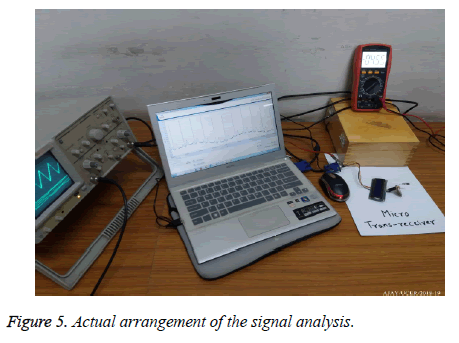
At the final stage of the bio medical toolkit the finally processed ECG signal is statistically compared with the already entered preset values as shown in the Table 1, using an array of comparators. All goes well, as long as all the parameters are inside the range, but as soon as any of the parameters rise above or fall below the stipulated values the designed algorithm gives the visual LED glow as well as audible beeps to attract the attention of the cardiologists or medical practitioner. All this practical/physical arrangement of the study, which is been carried out in the signal processing lab of the author’s institute is clearly shown in the Figure 5 depicts all the hardware and connections used in the study. In the same figure we can see that the author has used a micro trans receiver, which receives the live cardiac signal from the hand held portable ECG machine wirelessly [16,17].
| ECG segment | Time duration | Amplitude |
|---|---|---|
| QRS complex | <0.121 | 0.78-1.81 |
| PR segment | 0.083 | --- |
| PR interval | 0.118-0.202 | --- |
| QT interval | 0.35-0.45 | --- |
| ST segment | 0.12 | --- |
| T wave | 0.158 | <0.58 |
| P wave | 0.06-0.11 | <0.25 |
Table 1: Normal parameters of the electrocardiogram.
| Abnormal parameters | Heart disease | Risk level |
|---|---|---|
| Increased HR | Tachycardia | Low |
| Decreased HR | Bradycardia | Low/moderate |
| Increased PR | AV block | High |
| Prolonged PR | Coronary artery disease(CAD) | Moderate/high |
| P wave absent | Vent. fibrillation | Moderate/high |
| QRS<12 or atrial rate ≥ 400 | Atrial fibrillation | Moderate/high |
Table 2: Alarming conditions of ECG signal.
A digital multi meter, set on millivolt range is used to pre access the initial voltage of the received ECG signal to verify whether it needs any amplification or not. And by this method more than 53 samples of ECG data signal, each of 60 s length were taken from 53 different persons of different ages and gender, to analyse the response time of the results. Further they were compared by the time taken by the normal ECG reports in which, first the respective ECG chart is seen by the cardiologist, which takes the decision of any problem if incurred [18-20].
Out of all the 53 samples there were around 11 live samples which were found little abnormal or beyond the preset limits as per Table 1. And among these 11 samples, 3 of them were found with serious alarming conditions, for which the author and the team have requested to seek the advice of trained medical cardiologists immediately [21-24].
Results and Discussions
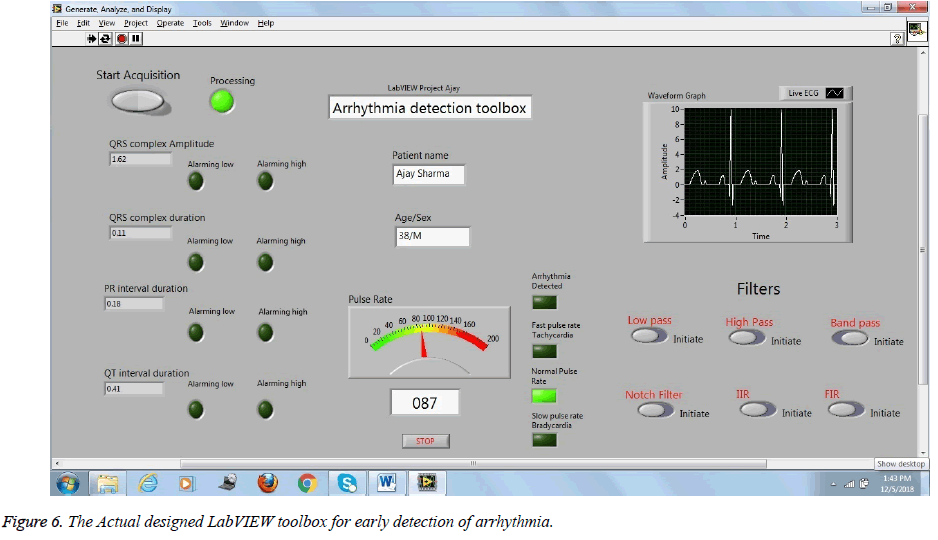
The DAQ interface of the basic biomedical toolkit of the NI LabVIEW software [26] is used for the recording and analyzing the vital live ECG signals obtained from the human body. In the toolkit the ECG Feature Extractor, Bio signal logger/viewer and HRV analyzer modules are extensively used for this study. For the toolbox designing version 8.5 of the LabVIEW is used. Figure 6 is the real snapshot of the actual designed toolbox for the early detection of arrhythmia. In this the normal preset values of the ECG signal parameters are preloaded, as given in the Table 1.
As seen in the figure above after feature extraction and preprocessing of the live ECG signals, these are subjected to the DAQ module of the LabVIEW 8.5, where their QRS complex, PR interval, QT interval, heart beat etc. are continuously recorded and compared with the already loaded normal values. As soon as any of the parameters vary beyond the normal range, as seen in the figure there are visual LEDs and audible beeps to notify or warn the cardiac expert about the alarming condition of the patient.
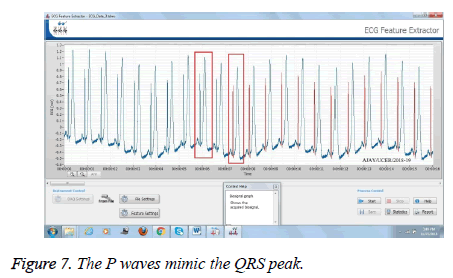
The algorithm gives the alarming condition signal of atrial fibrillation (Arrhythmia) in the following conditions: (i) Extreme irregular rhythm. (ii) Absence of P wave. (iii) QRS complex<120 ms. (iv) Heart beat greater than 150 bpm. (v) Fibrillatory waves may mimic P waves. Figure 7 shows a case where the P waves mimic the peak of the QRS complex, resulting in a confusion which leads to the misdiagnosis. In this figure we clearly see the red columns, which tell us about the copying waveforms.
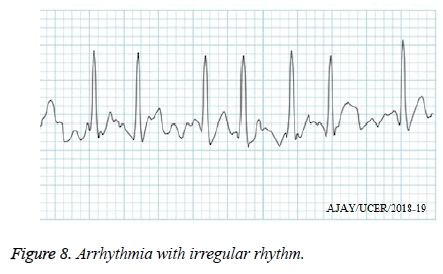
Similarly we have innumerable examples of the cardiac arrhythmia which is been diagnosed by this method. In some of the cases we see a irregularity of the rhythm as well as baseline wandering, which results in the absurd analysis and become an another example of atrial fibrillation (arrhythmia) as shown in the Figure 8, which depicts an actual trace of arrhythmia with irregular rhythm.
We can clearly see in the above trace that the distance between the peaks of the waveform is irregular and the rhythm is also not in a sequence, and this type of the atrial fibrillation (arrhythmia) is considered to be more dangerous than any other form.
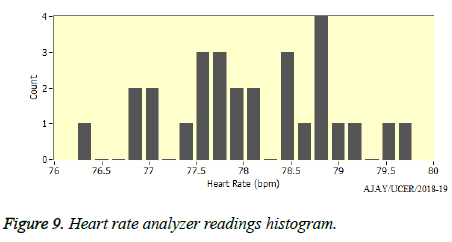
The readings of the heart rate analyzer are plotted in the form of a histogram, which is as shown in the Figure 9, obtained from the biomedical toolkit’s HRV analyzer module. We see in the figure that how many times a particular heart beat is executed are depicted clearly in this. For a normal healthy person it has been analysed that between 73 bpm and 80 bpm, the maximum pulse rates are obtained. And anything above or near to 150 bpm will be regarded as a condition of arrhythmia.
The Table 3 shows the actual readings of the ECG parameters recorded and analysed in the NI LabVIEW software, of the different patients which has been performed in the Laboratory of the author’s institute. For convenience and publication limitations, only 9 out of 53 samples are shown in the table above. All the above recordings are done for duration of 60 s and in all recordings the durations of the ECG components are in seconds (s) and the amplitudes are in millivolt (mV). As we can see in the above chart the last row, which says that the heart beats of Ms. Cynthia Joseph rises up to 148 bpm and the P wave is almost absent (0.02 mV) giving a clear sign of atrial fibrillation (arrhythmia). The author found that it takes approximately 65 to 66 s for a person to get the result of his ECG monitoring, which is a much faster method than the conventional ECG physical chart method. Thus in all the cases where a fast result or diagnosis is required, this method can be used.
| S. no. | Name of patient | Age/sex | Pulse rate (bpm) | Average QRS duration | Average QRS amplitude | Average P wave amplitude | Average PR interval | Average QT interval | Important comments |
|---|---|---|---|---|---|---|---|---|---|
| 1 | Ajay Sharma | 38/M | 82 | 0.11 | 1.7 | 0.23 | 0.16 | 0.41 | Normal RESULTS |
| 2 | Shonti Sen | 35/F | 104 | 0.07 | 2.6 | 0.16 | 0.06 | 0.28 | Tachycardia detected |
| 3 | Vikas Singh | 24/M | 76 | 0.1 | 1.8 | 0.24 | 0.17 | 0.38 | Normal results |
| 4 | Digvijay Rathore | 27/M | 88 | 0.12 | 1.9 | 0.18 | 0.14 | 0.32 | Normal results |
| 5 | Mahima Yadav | 22/F | 91 | 0.11 | 1.5 | 0.22 | 0.14 | 0.43 | Normal results |
| 6 | N.K. Balkrishnan | 64/M | 112 | 0.06 | 2.3 | 0.04 | 0.04 | 0.16 | Mild arrhythmia |
| 7 | Jon Michael | 52/M | 88 | 0.09 | 1.2 | 0.16 | 0.18 | 0.35 | Normal results |
| 8 | Mahesh Nagarjun | 42/M | 63 | 0.14 | 1.1 | 0.24 | 0.24 | 0.48 | Normal results |
| 9 | Cynthia Joseph | 37/F | 148 | 0.04 | 2.1 | 0.02 | 0.02 | 0.08 | Arrhythmia detected |
Table 3: Tabulation and observation chart of the readings.
Conclusions and Future Scope
The present study shows a satisfactory result of the process adopted for the early detection of the Atrial fibrillation (arrhythmia). In this we have taken readings of 53 different men and women out of which 11 persons readings were little abnormal, and out of these 11, there are 3 persons who are suffering from a real danger of cardiac heart arrest as in their case arrhythmia is detected. The total average time for the detection of any result taken is only 65 to 66 s, which is very exciting that the patient will be informed within minutes about his/her cardiac disorder.
In this study, there may be number of future enhancements that can be suggested in this existing project, such that if the monitoring panel/system can interfaced with TCP/IP (Internet), so the live readings can be sent anywhere in the world, where the expert or the medical practitioner or the cardiologist is sitting. Even further an ios or android based app can also be easily developed, which when logged by anyone (patient or the doctor) can see the live recordings of all the vital parameters.
References
- Pantelopoulos A, Bourbakis NG. Prognosis a wearable health-monitoring system for
- people at risk: Methodology and modeling. IEEE Trans Info Technol Biomed 2010; 14: 613-621.
- Islam A, Majumder A. Coronary artery disease in Bangladesh: a review. Ind Heart J 2013; 65: 424-435.
- Watts M, Shoat D. Trends in electrocardiograph design. J Inst Electron Radio Eng 1987; 57: 140.
- MIT-BIH arrhythmia database 2016.
- Bruser C, Diesel J, Zink MDH, Winter S, Schauerte P, Leonhardt S. Automatic detection of atrial fibrillation in cardiac vibration signals. IEEE J Biomed Health Inform 2013; 17: 162-171.
- Jose SK, Shambharkar CM, Chunkath J. HRV analysis using ballistocardiogram with LabVIEW. Comp Commun Technol International Conference 2015; 128-132.
- Tommy O. A circuit for contact monitoring in ECG. IEEE Trans Biomed Eng 1982.
- https: //www.healio.com/cardiology
- Tan KF, Chan KL, Choi K. Detection of the QRS complex, P wave and T wave in
- Electrocardiogram. Adv Med Sig Inform Proc 2000; 41-47.
- Deshmukh A, Gandole Y. ECG Feature extraction using NI LabVIEW. Biomed Workbench Int J Rec Sci Res 2015; 6: 5603-5607.
- Kaur P, Sharma RK. LabVIEW based design of heart disease detection system. Rec Adv Innov Eng (ICRAIE) IEEE 2014; 1-5.
- Dhar S, Mukhopadhyay SK, Mitra S, Baig MM, Mitra M. Noise reduction and ECG feature extraction using interpolation and Hilbert transform. Control Instrument Energy Commun 2014; 232-236.
- Giraldo BF, Marrugat J, Carninalti P. Design of an expert system for arrhythmia
- Diagnosis. Eng Med Biol Soc Proc Ann Int Conf IEEE 1992; 3: 1255-1256.
- Park J, Lee K, Kang K. Arrhythmia detection from heartbeat using k-nearest neighbor classifier. Bioinform Biomed (BIBM) 2013; 15-22.
- Chia P, Ong K, Bhullar HK. An accurate and automatic system for extracting features
- from ECG paper recordings: its use in clinical studies and telemedicine. Comp Cardiol Indianapolis IN, USA 1996; 469-472.
- de Chazal P, Duyer MO, Reilly RB. Automatic classification of heartbeat using ECG morphology and heart beat interval features. IEEE Trans Biomed Eng 2004; 51: 1196-1206.
- Rangayyan RM. Biomedical signal analysis. John Wiley Sons, Inc. New York, USA 2002; 93-99.
- Ledesma R, Jin Z. Resiliency analysis and modeling for real-time cardiovascular diagnostic devices. Signal Processing in Medicine and Biology Symposium (SPMB) IEEE 2012; 1-6.
- Mazomenos EB, Dwaipayan B, Amit A, Taihai C, Koushik M, James R, John M, Nick C. A low-complexity ECG feature extraction algorithm for mobile healthcare applications. IEEE J Biomed Health Inform 2013; 17: 459-469.
- Basu S, Khan YU. On the aspect of feature extraction and classification of the ECG signal. Communication Control and Intelligent Systems (CCIS) IEEE 2015; 190-193.
- Bruser C, Diesel J, Zink MDH, Winter S, Schauerte P, Leonhardt S. Automatic detection of atrial fibrillation in cardiac vibration signals. IEEE J Biomed Health Inform 2013; 17: 162-171.
- Yeha YC, Wang WJ. QRS complexes detection for ECG signal. The difference operation method (DOM). Comp Met Prog Biomed 2008; 9: 245-254.
- ECG feature extractor VI-LabVIEW. 2012 Biomedical Toolkit Help-National Instruments, Zone.ni.com, 2017.
