ISSN: 0970-938X (Print) | 0976-1683 (Electronic)
Biomedical Research
An International Journal of Medical Sciences
Research Article - Biomedical Research (2018) Volume 29, Issue 4
Exploring the relationships among MiR-200a expression, hepatic fibrosis, and liver inflammation in biliary atresia mice model
1Department of General Surgery, Zhongnan Hospital of Wuhan University, Wuhan, Hubei, PR China
2Department of General Surgery, Shenzhen Children’s Hospital, Shenzhen, Guangdong, PR China
- *Corresponding Author:
- Zhi-Su Liu
Department of General Surgery
Zhongnan Hospital of Wuhan University, PR China
Accepted on November 16, 2017
DOI: 10.4066/biomedicalresearch.29-17-3267
Visit for more related articles at Biomedical ResearchObjective: The aim of this study is to explore the relationships among miR-200a expression, hepatic fibrosis, and liver inflammation of Biliary Atresia (BA) in mice.
Methods: Newly born Balb/c mice received intraperitoneal injection with rhesus monkey rotavirus. The BA model of mice was established. The mice were killed 4, 8, 14, and 21 d after the injection. The normal control group received intraperitoneal injection with equal volume of virus culture solution. Blood samples from the experimental groups were collected before killing, and liver tissues were obtained through laparotomy. Alanine Aminotransferase (ALT), Aspartate Aminotransferase (AST), Serum Hyaluronic Acid (HA), Layer Fibronectin (LN), Procollagen III (PCIII), and Collagen type IV (CIV) contents were tested by a biochemical analyzer.
Results: All the experimental groups showed higher ALT, AST, HA, LN, PCIII, CIV, IL-6, and TNF-α contents than the normal control group (P<0.05). No significant change in CIV concentration was observed after 14 and 21 d. Significant difference was observed among the CIV concentrations of the experimental groups (P<0.05). Different experimental groups have different degrees of hepatic fibrosis and inflammation. Compared with the control group, the experimental groups had more severe hepatic fibrosis (P<0.05). Statistical significance was observed among the experimental groups (P<0.05). The relative expression levels of miR-200a mRNA of the experimental groups were significantly higher than that of the control group (P<0.05).
Conclusions: The relative expression of miR-200a mRNA in the liver tissues of virus-induced BA mice model is upregulated significantly. Therefore, miR-200a participate in the generation and development of hepatic fibrosis and liver inflammation in mice with BA.
Keywords
Biliary atresia, Hepatic fibrosis, Liver inflammation, miR-200a.
Introduction
MiRNAs are a type of endogenous noncoding micromolecule RNAs that are highly conservative in evolution and play an important role in controlling cell growth, proliferation, differentiation, migration, and apoptosis [1,2]. MiRNAs participate in the generation and development of hepatitis, liver cirrhosis, and liver cancer [3]. In this study, to explore the relationships among miR-200a expression, hepatic fibrosis, and liver inflammation, we established BA mice models through virus infection and tested the indexes of liver functions, hepatic fibrosis, and liver inflammation. The generation and development of hepatic fibrosis and inflammation were observed. We detected the expression levels of miR-200a mRNA in the liver tissues of mice to explore the relationship of dynamic expression of miR-200a with hepatic fibrosis and liver inflammation. The regulatory mechanisms involved in this relationship were identified.
Materials and Methods
Materials
A total of 48 6 w old SPF-level Balb/c mice weighing 18-22 g were used as test samples (the parent generation was bought from the animal experimental center of Yangzhou University, and the rest of the mice were offspring of the parent generation). Rhesus Monkey Rotavirus (RRV) MU10086 was used. MA104 cells were applied for virus culture and titration (Gibco Company). Other test materials include Trizol (Invitrogen Company), DNA fluorochrome SYBR Green I (Applied Biosystems Company), RNA reverse transcription kit (TaKaRa Company), primer (synthesized by Shanghai Sangon Biological Company), hydroxyproline detection kit (Nanjing Jiancheng Biology), Interleukin 6 (IL-6), Tumor Necrosis Factor (TNF-α), and ELISA kit (Hangzhou Hengao Biotech Co., Ltd).
Method
Establishment of BA mice model: A total of 48 newly born mice were selected as research objects and randomly divided into five groups. Each experimental group had six mice, while the normal control group contained 24 mice. The experimental groups received intraperitoneal injection with 20 μL PFU=106 RRV in 24 h, whereas the control group received intraperitoneal injection with equal volume of virus culture solution [4]. Weight changes, jaundice in hairless part, and defecation color were observed daily during the culture period. Six mice from each experimental group and from the normal control group were euthanized after 4, 8, 14, and 21 d, respectively. Blood samples and liver and biliary duct tissues were collected for subsequent tests.
Test of serological indexes: Alanine Aminotransferase (ALT), Aspartate Aminotransferase (AST), serum Hyaluronic Acid (HA), Layer Fibronectin (LN), Procollagen III (PCIII), and Collagen type IV (CIV) contents were tested by a biochemical analyzer. IL-6 and TNF-α contents in the sera of the groups were tested according to instruction provided in the ELISA kit [5,6].
Pathological observation
Liver lobe and biliary duct tissues at the same position in each mouse were collected for HE dye. Pathological changes in the liver and biliary ducts were observed under an optical microscope. BA mice models were established on the basis of biliary atresia conditions. In mice that underwent standard BA diagnosis, liver tissues were cut into slices for semiquantitative analysis of collagenous fibroplasias through the hepatic fibrosis classification method.
Statistical analysis
All data were analysed by using SPSS16.0. Measurement data were expressed as mean ± standard deviation (x̄ ± s); t-test and variance analysis were used in this study. The semiquantitative results of pathologies adopted the rank sum test. P<0.05 reflects statistical significance.
Results
Comparison of serological indexes of different groups
Serological indexes are listed in Table 1. Liver indexes and serum ALT, AST, HA, LN, PCIII, CIV, TNF-α, and IL-6 contents of the experimental groups were significantly higher than those of the normal control group (P<0.05). No significant difference was observed between the CIV concentrations of experimental groups 3 and 4. However, significant differences were observed among the rest experimental groups with respect to liver indexes and serum ALT, AST, HA, LN, PCIII, CIV, TNF-α, and IL-6 contents (P<0.05).
| Groups | Liver indexes (mg/g) | ALT (U/L) | AST (U/L) | IL-6 (ng/L) | |
|---|---|---|---|---|---|
| Control group | 5.32 ± 2.12 | 42.16 ± 10.35 | 132.20 ± 20.58 | 18.72 ± 3.16 | |
| Experimental group 1 | 6.21 ± 3.05a | 429.36 ± 28.57a | 490.51 ± 50.63a | 27.03 ± 2.15a | |
| Experimental group 2 | 6.61 ± 3.70ab | 637.55 ± 106.53ab | 669.73 ± 105.6ab | 36.40 ± 2.08ab | |
| Experimental group 3 | 6.93 ± 5.28abc | 820.74 ± 120.01abc | 875.74 ± 120.3abc | 52.72 ± 4.23abc | |
| Experimental group 4 | 7.42 ± 4.13abcd | 1026.63 ± 275.58abcd | 1120.53 ± 209.5abcd | 59.42 ± 5.26abcd | |
| Groups | TNF-α (ng/L) | HA (ng/L) | LN (ng/L) | PCIII (ng/L) | CIV (ng/L) |
| Control group | 22.89 ± 5.82 | 45.21 ± 1.23 | 24.81 ± 5.69 | 6.53 ± 2.37 | 10.93 ± 2.69 |
| Experimental group 1 | 30.63 ± 5.53a | 95.64 ± 2.56a | 42.95 ± 4.55a | 10.41 ± 5.67a | 15.81 ± 3.75a |
| Experimental group 2 | 38.72 ± 4.34ab | 169.37 ± 7.88ab | 63.79 ± 3.69ab | 18.67 ± 4.56ab | 21.15 ± 4.89ab |
| Experimental group 3 | 45.64 ± 6.96abc | 278.39 ± 10.05abc | 86.59 ± 5.96abc | 23.88 ± 5.89abc | 27.86 ± 5.69abc |
| Experimental group 4 | 58.73 ± 7.69abcd | 356.58 ± 15.37abcd | 97.16 ± 8.63abcd | 25.70 ± 6.79abcd | 28.32 ± 8.02abc |
Note: compared with normal control group, aP<0.05; compared with experimental group 1, bP<0.05; compared with experimental group 2, cP<0.05; compared with experimental group 3, dP<0.05.
Table 1. Serological indexes of different groups (x̄ ± s).
Pathological changes of liver
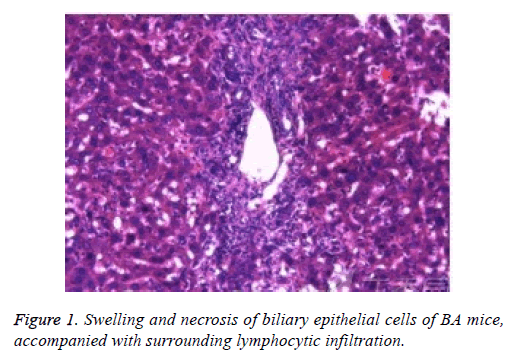
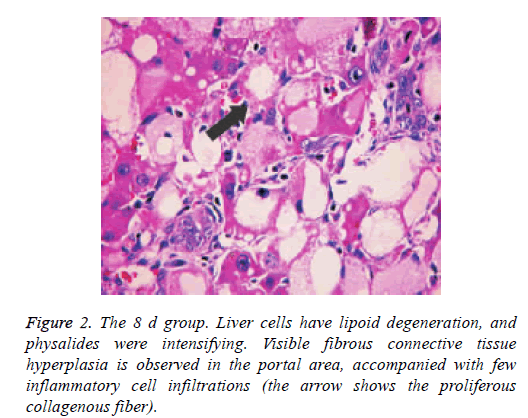
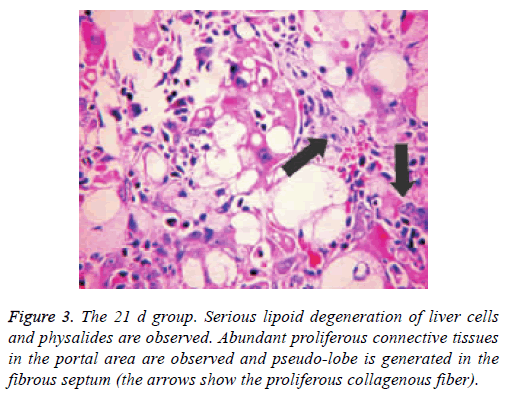
Liver tissue and BA HE staining results of the different groups are shown in Figures 1-3. Hepatic fibrosis results are shown in Table 2. Hepatic fibrosis differed significantly between the experimental and control groups (P<0.05). A statistically significant difference was observed among the experimental groups with respect to hepatic fibrosis (P<0.05).
| Groups | Number of mice | Grading of hepatic fibrosis | ||||||
|---|---|---|---|---|---|---|---|---|
| 0 | I | II | III | IV | V | VI | ||
| Control group | 6 | 4 | 2 | 0 | 0 | 0 | 0 | 0 |
| Experimental group 1 | 6 | 0 | 1 | 3 | 2 | 0 | 0 | 0 |
| Experimental group 2 | 6 | 0 | 0 | 2 | 2 | 2 | 1 | 0 |
| Experimental group 3 | 6 | 0 | 0 | 0 | 1 | 3 | 2 | 0 |
| Experimental group 4 | 6 | 0 | 0 | 0 | 0 | 2 | 3 | 1 |
Table 2. Grading of hepatic fibrosis of different groups.
Expression levels of miR-200a mRNA in liver tissues of BA mice
Experimental groups 1-4 had significantly higher relative expression miR-200a mRNA levels in liver tissues than the control group (P<0.05). Differences among the miR-200a mRNA relative expression levels of the experimental groups were statistically significant (P<0.05).
Discussion
BA mice models that received intraperitoneal injection with RRV may present liver inflammation and hepatic fibrosis. After 20 μL PFU=106 RRV was injected, the mice showed energy loss, poor appetite, and hypoevolutism [7]. The degree of liver damage in mice was evaluated according to ALT and AST levels in serum. We evaluated hepatic fibrosis and liver inflammation degree according to the four items of serum hepatic fibrosis and inflammation factor levels [8,9]. The evaluation was based on the pathological fibrosis scores of the liver tissues. The experimental groups showed significantly higher serum ALT, AST, HA, LN, PCIII, CIV, IL-6, and TNF-α contents than the control group (P<0.05). No significant difference of CIV contents was found between the experimental groups 3 and 4. However, statistically significant differences were found between any two of the rest of the experimental groups in terms of liver indexes and serum ALT, AST, HA, LN, PCIII, CIV, TNF-α, and IL-6 contents (P<0.05). This finding revealed that mice suffer a certain degree of liver damage after virus injection. Liver inflammation and hepatic fibrosis intensified gradually as time progressed. Basing on serological results and histopathological examination results, we observed that hepatic fibrosis was absent in the experimental group 2, although the group showed typical liver inflammation. Liver fiber texture is composed of Extracellular Matrix (ECM) and other cell components. ECM mainly participates in liver tissue proliferation and repair. HSCs are activated when the liver is damaged and secrete abundant ECM and inflammatory factors (e.g., TNF-α and IL-6), thus influencing substantial functions of the liver.
In this experiment, miR-200a mRNA expression levels in the liver tissues from different groups were tested by using RTPCR. The miR-200a mRNA expression levels of the experimental groups were far higher than that of the control group (P<0.05). Statistically significant differences were found among the experimental groups (P<0.05). Serological results were compared with the histopathological results, and the results showed that the relative expression of miR-200a mRNA increased with intensified hepatic fibrosis and liver inflammation. The expression level of miR-200a mRNA reached its peak after 14 d. The histopathological slicing results implied the formation of hepatic fibrosis during this period. Therefore, miR-200a is directly related with hepatic fibrosis. This finding is consistent with domestic and foreign research results [10].
MiR-200a mRNA expression levels in all the experimental groups were upregulated at varying extents during the progress of hepatic fibrosis and liver inflammation in the BA mice model. MiR-200a mRNA expression was positively correlated with hepatic fibrosis and liver inflammation. The regulatory mechanism may be related with HSC activation or EMT activation by the Kupffer cell secretion of TGF-β and plateletderived growth factor. The specific mechanism requires further investigation.
Conclusion
In summary, hepatic fibrosis and liver inflammation in mice exposed to virus infection intensified gradually over time. The relative expression levels of miR-200a mRNA in the liver tissues were considerably upregulated, indicating that miR-200a participate in regulation of the development of hepatic fibrosis and liver inflammation. However, the mechanism involved in the upregulation remains unknown. The influencing mechanisms of miR-200a in hepatic fibrosis and liver inflammation warrant further study. Nevertheless, our findings have important significance to the clinical treatment of hepatic fibrosis and liver inflammation.
References
- Feldman AG, Tucker RM, Fenner EK, Pelanda R, Mack CL. B Cell deficient mice are protected from biliary obstruction in the rotavirus-induced mouse model of biliary atresia. PLoS One 2013; 8: e73644.
- Feng J, Yang J, Zheng S, Qiu Y, Chai C. Silencing of the rotavirus NSP4 protein decreases the incidence of biliary atresia in murine model. PLoS One 2011; 6: 23655.
- Mangla B, Patel KS, Kumar P, Kulkarni GT. Ligand mediated carbon nanotubes based delivery of an anticancer agent. Lat Am J Pharm 2017; 3610: 2081-2091.
- Shivakumar P, Sabla GE, Whitington P, Chougnet CA , Bezerra JA. Neonatal NK cells target the mouse duct epithelium via Nkg2d and drive tissue-specific injury in experimental biliary atresia. J Clin Invest 2009; 119: 2281-2290.
- Khan SM, Nisar-ur-Rehman, Hanif M, Abbas G. Matrix tablets of isosorbide mononitrate for controlled release drug delivery by central composite response surface design. Lat Am J Pharm 2017; 36: 2071-2080.
- Tang V, Cofer ZC, Cui S, Sapp V, Loomes KM, Matthews RP. Loss of a candidate biliary atresia susceptibility gene, add3a, causes biliary developmental defects in zebrafish. J Pediatr Gastroenterol Nutr 2016; 63: 524-530.
- Ma CC, Xiong Z, Zhu GN, Wang C, Zong G, Wang HL, Bian EB, Zhao B. Long non-coding RNA ATB promotes glioma malignancy by negatively regulating miR-200a. J Exp Clin Cancer Res 2016; 35: 90.
- AL-Yahya AAI, Asad M. Antiulcer activity of gum Arabic and its interaction with antiulcer effect of ranitidine in rats. Biomed Res India 2016; 27: 1102-1106.
- Hu B, Shi C, Lei R, Lu D, Luo W, Qin S, Zhou Y, Jiang H. Interleukin-22 ameliorates liver fibrosis through miR-200a/beta-catenin. Sci Rep 2016; 6: 36436.
- Hu B, Qiu-Lan H, Lei R, Shi C, Jiang H, Qin S. Interleukin-9 promotes pancreatic cancer cells proliferation and migration via the miR-200a/beta-catenin axis. Biomed Res Int 2017; 2017: 2831056.


