ISSN: 0970-938X (Print) | 0976-1683 (Electronic)
Biomedical Research
An International Journal of Medical Sciences
Commentary - Biomedical Research (2017) Volume 28, Issue 9
Reasoning of EEG waveform using Revised Principal Component Analysis (RPCA)
1Department of Electronics and Instrumentation Engineering, Bannari Amman Institute of Technology, Tamil Nadu, India
2Department of Electronics and Communication Engineering, SNS College of Technology, Tamil Nadu, India
- *Corresponding Author:
- Deepa R
Department of Electronics and Instrumentation Engineering
Bannari Amman Institute of Technology, India
Accepted date: February 11, 2017
The analysis of brain activity and classification is a prime issue in Electroencephalogram (EEG) signal processing these days. The related exertion has been taken to estimate the brain activity on the basis of non-invasive power spectrum analysis. For this, modified approach involving Revised Principal Component Analysis (RPCA), multipliers and Support Vector Machine (SVM) Classifiers with two distinct features are contrasted to investigate the behavior of brain’s electrical activity of a visual attention. The proposed method of EEG classification can be very useful in predicting the action of brain, analysing the activity of the signal in open or in close condition and it provides better behavior of the frequency. The EEG data has been acquired from a WindDAQ Acquisition and the EEG analysis has been carried out in MATLAB platform to perform the work in this paper.
Keywords
Brain, EEG, Power spectrum, Revised Principal Component Analysis (RPCA), Multiplier, Support Vector Machine (SVM).
Introduction
The paper contributes a preliminary work of EEG for the examination of visual attention with the activity of brain. The correlation between visual attention and brain activity is one of the most provoking tasks in existing biomedical engineering. In general, the visual activity is controlled by the brain. It means that the visual activity has referent with brain activity. Regrettably, recognizing the activity of the brain is multifaceted corresponding to the visual attention is very tedious. The recurrent approach finds the power spectrum analysis between brain activity and visual activity. Feature extraction and dimensionality reduction for distinct signals are analysed using RPCA. The multipliers are used for the estimation of the status and the classification is to be carried out which gives the electrical activity on all the condition with better accuracy [1-4]. Support vector machine hypothesis hyper plane in elevation for classification. Instinctively, a virtuous sorting attained with the hyper plane that has prime space to the nearby training data point of any class. Our proposed classifiers in SVM involve features of accuracy, precision, sensitivity and specificity.
Most of the literature survey concerns recognizing visual attention are listed below.
Mohamed et al. proposed a single-channel speech enhancement method which relates the brain activity by having a combination of the wavelet packet transform and an improved version of the Principal Component Analysis (PCA) [5]. This method fails to integrate the ability of PCA to correlate the coefficients by extracting a direct relationship with wavelet packets, since it provides noise during shrinkage. It fails to have a direct relation and it is not more sensitive.
Kottaimalai et al. proposed a paper on EEG signal classification using principal component analysis with neural network in brain computer interface applications [6]. It classifies the mental tasks, the brain signals are trained using principal component analysis with artificial neural network. PCA is a dominant tool for analysing data and finding patterns in it. The major drawback of this paper is time consuming task and it is impossible to train all the sets of data in neural network. For real time application this method fails. Our proposed algorithm overcomes these drawbacks by using support vector machine technique.
Shi et al. proposed a paper titled a robust principal component analysis algorithm for EEG-based vigilance estimation [7]. In this model the PCA algorithm reduces the dimension of EEG features for vigilance estimation. The performance of this model is compared with standard PCA, L1norm PCA, sparse PCA, and robust PCA in feature dimension reduction on an EEG data set of twenty-three subjects. This method fails in analysing particular data sets which is not able to comment on whole set and not accurate up to the mean. Experimental result demonstrates the robustness and performance of robust PCA, which are better than other algorithms for both off-line and on-line vigilance estimation. The proposed method overcomes this method by having hold diagnolization of PCA. It is proved that the experimental results and the real time results are up to the quench.
Karl proposed a paper titled nonlinear PCA characterizing interactions between modes of brain activity. This paper presents a nonlinear principal component analysis that identifies underlying sources causing the expression of spatial modes or patterns of activity in neuroimaging time-series [8]. The critical aspect of this technique is that, in relation to conventional PCA, the sources can interact to produce (secondorder) spatial modes that represent the modulation of one (second-order) spatial mode by another. The plead movements are not reduced for this study.
Experiments
In this experiment, database for EEG reading is being acquired from the repository which is used for the system analysis. Database with 64-bit channel data measures the different regions of human brain uses the range of frequencies up to 50 Hz. The proposed method performs a time frequency decomposition of the EEG data and transforms each local spectrum, so that the average prestimulus effect is subtracted out. According to the data, the spectrum can be classified into post-stimulus segment into classes or pre-stimulus segment. Using these results, it generates a Discrete Fourier Transform (DFT) display in which the time frequency plane is segmented into regions with homogeneous activation patterns. The exponential form of signal is converted to a suitable signal through notch filter which is used for the power analysis around the circulated area. Such artifacts are used in both open and close range for analysis. These signals are to be removed from conductivity of electrodes, which gains the attribute of separate range of the data [9].
Methods
Notch filter design for EEG analysis
A stable filter affords each incomplete input signal to attain a limited filter response. A filter which fails these conditions may cause changes in the stability of the system. Definite design approaches can assure stability. For example, implementing the feed-forward Finite Impulse Response (FIR) filter. Pertaining to feedback circuits, it can have advantages and may consequently be preferred, even if this class of filter includes unstable filters. The filter design is implemented with the following conditions.
Window size=5;
Desired Freq=(zeros 0.4 0.4 ones);
Desired mag=(ones ones zeros zeros);
No. of channel =(size (outvaldata,1)-1)/2;
fs=20000;
f0=50;fn=fs/2;
Freq ratio=f0/fn;
Notch width=0.1;
Zeros=(exp (sqrt (-1) × pi × freq ratio), exp (-sqrt (-1) × pi × freq ratio));
Poles=(1-notchwidth) × zeros;
According to the uncertainty relation of the Fourier transform, the product of width of filter's impulse response function and the width of its frequency function must exceed a certain constant. This means that any requirement on the filter's locality also implies a bound on its frequency functions width. Consequently, it may not be possible to meet the requirements on the locality of filter's impulse response function as well as on its frequency function simultaneously. This is a typical example of contradicting requirements.
Multiplier design for EEG analysis
Multiplier performs the operation of consecutive addition of numbers. Products of limited variables are added serially, which results in reducing the amount of hardware used. It is probable to add partial products using combinational logic circuits, by usage of parallel multiplier. Conversely, it is probable to use compression method to reduce the reckoning of partial products prior to addition operation.
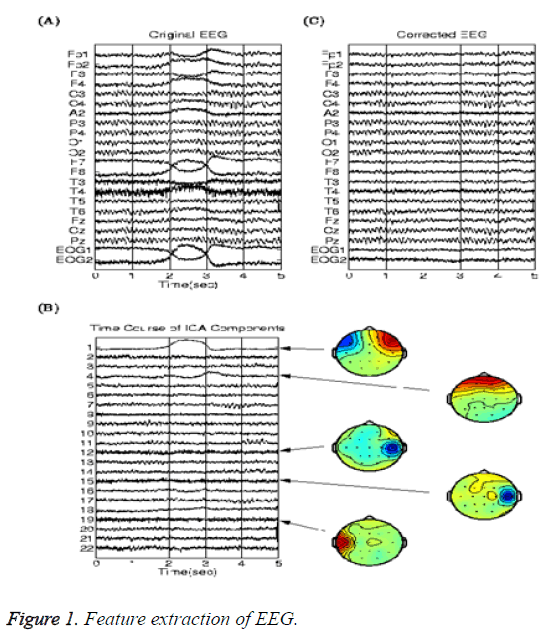
In this operation, the analysis of EEG signal uses power spectrum and it is initiated by defining the sampling rate frequency and the extracted signal, which is being collected and the values from repository are being obtained and they were filtered out and values are truncated for the frequency signal (Figure 1), which is to be analysed [10]. The frequency of signal is allowed for power spectrum analysis using welch transformation, which results in the estimation of power signal at various frequencies by spectral density estimation. It involves the usage of periodogram which would result in splitting of data segments with length and overlapping occurs either wholly or partially based on windowing types. During the process of truncation or reduction, the multiplier data are to be converted to various types and then the dividend operation is being performed.
Revised principal component analysis (RPCA)
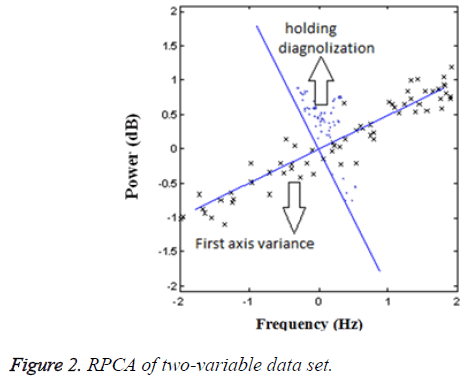
Revised Principal Component Analysis (RPCA), is a technique used to transform the multi-variable data by rotation [2]. Rotation is originated in that the first axis corresponds to the first component, which rotates the path, where the variance of the data is greatest and it is added to revise the second axis variance by using hold diagnolization of vectors [11].
A multivariate analysis issue could begin with a significant number of connected factors. Principal component analysis is a dimension reduction tool that can be utilized favourably as a part of such circumstances. Principal component analysis targets at reducing the set of variables to a little set that still contains the majority of the data in the expansive set. It is regularly valuable to measure data as far as in terms of its principal components rather than on a normal x-y axis. They are the fundamental structure. They are the bearings where there is most variance and the directions where the information is most spread out. While this principal component replaces at least one of the original factors it is to be noticed that they are not unilateral transform. So inverse changes are unrealistic which prevents the usage of inverse transform.
Figure 2 shows an example, with a two-variable data set where the new axis is drawn and the plot of EEG data has spread out and shows the occurrence of largest variance to obtain the probable principal component. The plot of occurrence (blue) in the graph depicts the hold diagnolization of vectors, which is being obtained as follows. This hold diagnolization converts the minimum variance to the maximum variance and proving allowances for principal components.
Consider the matrix A, invertible matrix P and assume there exists a diagonal matrix Z for hold diagnolization.
A=P-1 ZP
A-λIn=P-1 ZP-λIn=P-1 ZP-λIn P-1 P=P-1 (Z-λIn) P
Let us consider a multivariate EEG data matrix, with q rows and r columns. The principal elements of each row are measured on a subject such as power and frequencies of each wave, where λ is the Eigen decomposition of matrix. Normalize the data matrix so that each column mean is 0 and each column variance is 1. In order to maximize variance diagonal matrix Z is introduced, where Zi,i=1,.... p. The main idea behind principal component analysis is to derive a linear function y for each of the vector variables Zi. This linear function possesses an extremely important property, namely its variance is maximized.
This linear capacity is referred to as a part of Z. To outline the calculation of a single element for the jth vector, consider the item Y=ZV, where v’ is a column vector of V, and V is a p × p coefficient lattice that conveys the p-component variable z into the determined n-component variable y. V is known as the Eigen vector grid.
The measurement of z is 1 × p and v’is p × 1.
yij=v’1 z1i+v’ 2z2i++v’p zpi
Transformation for EEG analysis
The main purpose of the Fast Fourier Transform (FFT) is to have a faster polynomial multiplication. The frequency from the multiplier is used as input signal to FFT. Hence by utilizing each periodicity in the sine are multiplied to the transforms. Hence, the usage of FFT results in reduction of data sets. Ever since at each stage of processing, the previous stages are combined into n point at last. For analysing the EEG signals, the signals are to be bit reversed for the process of protecting the base frequency of signal [12]. While bit reversing the lower bound values are converted into upper bound and vice versa to protect the signals base frequency which results in preventing the frequency loss. Since the FFT locates data either in Decimation in Time (DIT) or in Decimation in Frequency (DIF) in order to estimate both the location of frequency and time. Discrete Wavelet Transform (DWT) is to sample the wavelets into discrete wavelets. It has a compressed data set and it also provides the undershoot value and ringing values of the data distributed over stability analysis [13].
Support vector machine classifier
Support vector machine is a supervised learning process, applied for evaluating the training data, which finds an ideal way to analyse the EEG images into their respective classes namely normal awaken/sleeping, abnormal awaken/sleeping. SVM is a robust method used for data grouping and regression. The SVM methods are described in detail [14]. SVM represents a hyper plane for sorting the given data linearly into separate classes. SVM is used to distinguish between the various classes such as normal and abnormal. The training data should be statistically sufficient. The classification parameters are formed, according to the calculated features using the SVM algorithm [14]. There are number of learning parameters that can be applied in creating SVM. For complications in sorting and regression, the optimum σ can be figured on the source of fisher discrimination. Based on scale space theory we determine the existence of a certain range of σ, within which the generalization performance is stable. A proper σ contained by the range can be accomplished through dynamic evaluation. Moreover, the lower bound iterating step size of σ is given. These classification parameters are used for classifying the data. The contents are sorted into various algorithms and are observed as follows is shown in Table 1.
| Conditions | Accuracy (%) | Precision (%) | Sensitivity | Specificity |
|---|---|---|---|---|
| Normal Awaken | 96.3 | 92.6 | 0.25 | 0.1 |
| Normal Sleeping | 96.2 | 91.3 | 0.20 | 0.1 |
| Abnormal Awaken | 95.4 | 91.2 | 0.19 | 0.1 |
| Abnormal Sleeping | 95.4 | 91.1 | 0.20 | 0.1 |
Table 1: SVM features.
Results and Discussions
In the EEG analysis, the PHYSIONET databases are taken as training input vectors and it is experimented using feature extraction. The classification algorithms are used to estimate the attentions of each and every person at different instants are verified [15].
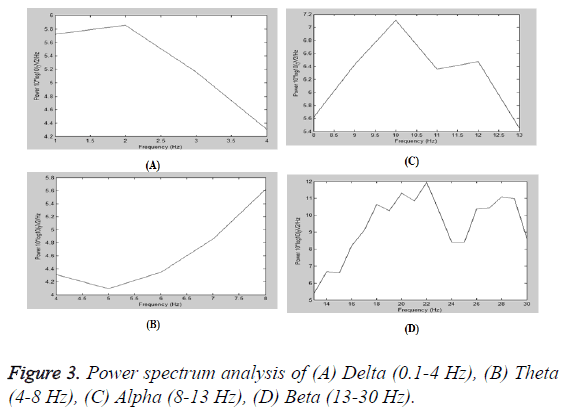
In this analysis, the sampling time of 10 s with the frequency of 1500 Hz channel is taken, it is sub-divided as 50 Hz and the signals are sampled. The specified data after processing gives the following results shown in Figure 3.
Classified the readings of each of the frequency band with the power and it is shown in Table 2.
| Waves | Frequency band (Hz) | Power (dB) | Corresponding frequency (Hz) |
|---|---|---|---|
| Delta | 0.1- 4 | 5-6 | 0-0.5 |
| Theta | 4-8 | 8-9 | 4.5-5 |
| Alpha | 8-13 | 6-7 | 8.5-9 |
| Beta | 13-30 | 10-12 | 18-22 |
Table 2: Frequency and power table.
• Delta wave (0.1-4 Hz)-Maximum power 5-6 dB corresponds to 0-0.5 Hz.
• Theta wave (4-8 Hz)-Maximum power 8-9 dB corresponds to 4.5-5 Hz.
• Alpha wave (8-13 Hz)-Maximum power 6-7 dB corresponds to 8.5-9 Hz.
• Beta Wave (13-30 Hz)-Maximum power 10-12 dB corresponds to 18-22 Hz.
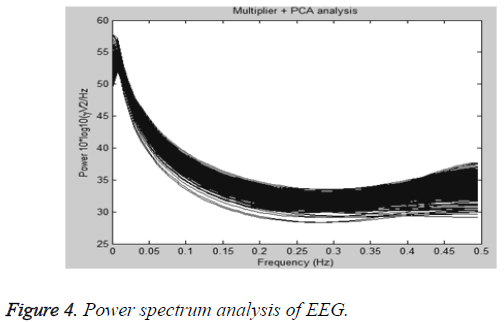
It is observed that, the maximum signal power is up to 30 dB. The EEG signals contains some components which shows maximum power in the range of 0-5 Hz but same power level also reaches in frequency bands of 15-25 Hz and rest of the frequencies have low power levels. From Figure 4, the following observations are found.
The revised principal component analysis uses hold diagnolization technique and it utilizes maximum and minimum variance of the data distribution for processing the principal components when compared to the principal component analysis. The PCA uses dimension reduction technique, whose axes oriented in the directions of the maximum variance of an input data set. The variance is maximum along the first axis, the second axis will maximize variance subject to the first axis orthogonality and so forth, the last axis having the least variance of all possible ones, can be ignored. The directions maximizing variance do not maximize the information and the PCA does not perform linear regression or other similar operations, permits the input vector to be restored on the basis of partial information. All additional information pertaining to the vector is ignored.
Conclusion
From the power spectrum analysis, we conclude that the above approach results in better behavior of the frequency in the range of 18 to 22 Hz. It has the signal strength of 10-12 dB maximum in beta bands of the signal. It is generated corresponding to cognitive process of brain or visual attention. Normally, visual attention of EEG signal results greater than 13 dB, which gives the proper awaken and closure of the human being in both normally open and close conditions. This method helps in designing the system, to check the defects or problem in cognitive task of brain by matching the patient EEG signal with above results sets. The results are more effective in sustaining the person state.
References
- Wang J, Liu Y. A feature extraction method for brain computer interface based on multivariate empirical mode decomposition. Sheng Wu Yi Xue Gong Cheng Xue Za Zhi 2015; 32: 451-454, 464.
- Wang C, Zou J, Zhang J, Wang M, Wang R. Feature extraction and recognition of epileptiform activity in EEG by combining PCA with ApEn. Cogn Neurodyn 2010; 4: 233-240.
- Barbati G, Porcaro C, Zappasodi F, Rossini PM, Tecchio F. Optimization of an independent component analysis approach for artifact identification and removal in magnetoencephalographic signals. Clin Neurophysiol 2004; 115: 1220-1232.
- Amari S, Wu S. Improving support vector machine classifiers by modifying kernel functions. Neural Networks 1999; 12: 783-789.
- Mohamed AB. Speech enhancement based on wavelet packet of an improved principal component analysis. Computer Speech Language 2016; 35: 58-72.
- Kottaimalai R. EEG signal classification using principal component analysis with neural network in brain computer interface applications. IEEE Int Conf Emerg Trends Comput Commun Nanotechnol 2013; 227-231.
- Shi LC, Duan RN, Lu BL. A robust principal component analysis algorithm for EEG-based vigilance estimation. Conf Proc IEEE Eng Med Biol Soc 2013; 2013: 6623-6626.
- Friston K, Phillips J, Chawla D, Buchel C. Nonlinear PCA: characterizing interactions between modes of brain activity. Philos Trans R Soc Lond B Biol Sci 2000; 355: 135-146.
- Wang J, Yang L. Tensor feature extraction using multi-linear principal component analysis for brain computer interface. Sheng Wu Yi Xue Gong Cheng Xue Za Zhi 2015; 32: 526-530.
- de Cheveigné A, Parra LC. Joint decorrelation, a versatile tool for multichannel data analysis. Neuroimage 2014; 98: 487-505.
- Barry RJ, De Blasio FM, Bernat EM, Steiner GZ. Event-related EEG time-frequency PCA and the orienting reflex to auditory stimuli. Psychophysiology 2015; 52: 555-561.
- Hu L, Zhang ZG, Mouraux A, Iannetti GD. Multiple linear regression to estimate time-frequency electrophysiological responses in single trials. Neuroimage 2015; 111: 442-453.
- Kiymik MK, Akin M, Subasi A. Automatic recognition of alertness level by using wavelet transform and artificial neural network. J Neurosci Methods 2004; 139: 231-240.
- Zhao J, Zhou W, Liu K, Cai D. Application of SVM and wavelet analysis in EEG classification. Sheng Wu Yi Xue Gong Cheng Xue Za Zhi 2011; 28: 277-279.
- Xiao R, Ding L. EEG resolutions in detecting and decoding finger movements from spectral analysis. Front Neurosci 2015; 9: 308.


