ISSN: 0970-938X (Print) | 0976-1683 (Electronic)
Biomedical Research
An International Journal of Medical Sciences
- Biomedical Research (2005) Volume 16, Issue 2
Relation of anthropometry to CVD risk factors in young obese women
Anupama Kamath, Nandini M*, Kedilaya H.P2, Vivian D'Souza1
1Department of Biochemistry, Centre for basic sciences, Kasturba Medical College, Mangalore, India
2Department of Biochemistry, A.J.Istititute of Health Sciences, Mangalore, India
- *Corresponding Author:
- Dr. M. Nandini
Department of Biochemistry,
Centre for Basic Sciences,
Kasturba Medical College,
Bejai Mangalore 575004, India
Accepted date: May 7 2005
Obesity at an early age is thought to have a greater influence on cardiovascular disease than late onset obesity. The excess body fat associated with obesity is considered a risk factor for many chronic diseases and predisposes to premature cardiovascular disease (CVD). The main objective of the study was to know the correlation of obesity as determined by anthropometry (height, weight, triceps skinfold thickness, hip and waist circumference) to altered blood lipid levels, glucose, fibrinogen and Blood Pressure (BP) in nullliparous women of 18-26 years. Twenty five nulliparous women with a Body Mass Index (BMI) >25 Kg/m2 were selected for the study. Control group included 25 nulliparous women of the same age group with BMI < 25 Kg/m2. A significant increase in waist circumference and skinfold thickness was observed in the obese subjects. Biochemical parameters estimated showed a significant decrease in High-density lipoprotein cholesterol (HDL-C) and increase in Total cholesterol / High-density lipoprotein cholesterol (TC/ HDL-C) ratio in obese subjects. A positive correlation of Body Mass Index (BMI) with waist circumference (WC) and diastolic blood pressure (DBP) was observed. Conversely BMI correlated negatively with HDL-C and triglycerides (TG). The study shows that simple anthropometric data like BMI and waist circumference may be used for screening obese individuals to detect early risk of CVD.
Keywords
Obesity, young women, BMI, HDL-C, CVD
Introduction
Obesity at an early age is thought to have a greater influence on cardiovascular disease than late onset obesity. The excess body fat associated with obesity is considered a risk factor for many chronic diseases and predisposes to premature cardiovascular disease (CVD). The main objective of the study was to know the correlation of obesity as determined by anthropometry (height, weight, triceps skinfold thickness, hip and waist circumference) to altered blood lipid levels, glucose, fibrinogen and Blood Pressure (BP) in nullliparous women of 18-26 years. Twenty five nulliparous women with a Body Mass Index (BMI) >25 Kg/m2 were selected for the study. Control group included 25 nulliparous women of the same age group with BMI < 25 Kg/m2.
A significant increase in waist circumference and skinfold thickness was observed in the obese subjects. Biochemical parameters estimated showed a significant decrease in High-density lipoprotein cholesterol (HDL-C) and increase in Total cholesterol / High-density lipoprotein cholesterol (TC/ HDL-C) ratio in obese subjects. A positive correlation of Body Mass Index (BMI) with waist circumference (WC) and diastolic blood pressure (DBP) was observed. Conversely BMI correlated negatively with HDL-C and triglycerides (TG). The study shows that simple anthropometric data like BMI and waist circumference may be used for screening obese individuals to detect early risk of CVD.
Introduction
Obesity and overweight are currently considered major public health problems both in developed and developing countries. The risk increases with increasing adiposity and there is excess mortality at any age. The importance of fat distribution has been realized in recent years. It has now become obvious that metabolic complications of obesity are associated with upper body segment or abdominal obesity [1]. Increased risk of cardiovascular disease (CVD) has been found in individuals presenting with distribution of excess fat in the abdominal region [2,3]. Obesity itself is a cardiovascular risk factor and there is also a relationship between obesity and hypertension. Even in healthy young people who are obese, some degree of myocardial d ysfunction has been demonstrated echocardiographically which tends to be reversible with weight loss [4].
Though a number of techniques are available to measure body fat, anthropometry is the simplest and most practical. Among them Body Mass Index (BMI) gives a reasonable estimate of adiposity. Use of BMI eliminates the problem of frame size and also allows classification of overweight and obesity to be estab-lished. This provides a rational scheme for treatment. Recently non HDL-C has been suggested as a better tool for the assessment of cardiovascular risk and treatment than LDL-C [5]. The increasing epidemic of obesity in the world has stimulated interest in identifying / predicting individuals who are at greatest health risk at an early age [6]. This is particularly important to allow early implementation of preventive strategies. The knowledge of relative risk of CVD in young obese nulliparous women is meager. Earlier studies have been usually done on subjects aged 30 years and above. Hence, the present study focused on the relation of anthropometry to CVD risk factors in obese, nulliparous women in the age group 18-26 years.
Materials and Methods
The study was carried out in Mangalore, Dakshina Kannada district. It involved 50 women in the age group of 18-26 years of which, twenty five women with BMI ≥ 25 kg/m2 constituted the test group while twenty five women whose BMI was < 25kg/m2 were taken as controls. Some subjects of the test group consti-tuted those people who opted for obesity treatment under ‘Shantivana’ hospital, Dharmasthala.
All the women selected were nulliparous, non-diabetic and healthy subjects. An informed consent was taken from the subjects who participated in the study. The subjects were informed to come in the post absorptive state and the anthropometric data (height, weight, waist circumference, hip circumference, triceps skinfold thickness) was measured. 5ml of venous blood was drawn for the estimation of glucose, lipid parameters and fibrinogen.
Anthropometry
The height was measured barefoot with head in horizontal plane to the nearest 0.1cm using a graduated tape attached to the wall. The weight was measured in light clothes using a weighing machine. BMI (Wt. in Kg / Ht. in m2) was calculated. The hip circumference (HC) was measured at the widest diameter over greater trochanter using a non–elastic measuring tape and the waist circumference (WC) was measured midway between the lateral lower ribs and the iliac crest after a gentle expiration while the subject was standing. Waist-hip-ratio (WHR) was calculated from the above data. The triceps skin fold thickness (TSF) was measured on the posterior aspect of the left arm at the midpoint of acromion and olecranon process using a skin caliper (Fat-O- Measure, COSPEN Ltd.). Blood pressure (BP) was recorded in the same arm using a sphygmomanometer with the subject in upright posture.
Blood investigations
5ml of venous blood was drawn after a minimum of 10 hours fast. 2ml of this was transferred to a fluoride bottle and the rest to EDTA bottle. Plasma was separated within 1 hour. Fasting blood glucose (FBS) was estimated by GOD-PAP methodology using Agappe manual diagnostic kit. Total cholesterol estimation was done by CHOD-PAP method. The enzymatic procedure of Allain et al [7] was adopted. HDL–cholesterol was estimated by the procedure of Burnstein et al [8] and serum triglycerides es-timation done by GPO–PAP–ESPAS method. The enzymatic procedure of Werner et al [9,10] was followed. Plasma fibrinogen assay was done by the Biuret method [11]. LDL–C was calculated using Friedewald and Fredricksons formula. Non HDL–C was calculated by subtracting HDL-C from total cholesterol. The atherogenic index TC/ HDL-C was calculated and compared with other indices such as LDL-C/ HDL–C; non HDL–C/ HDL–C.
For Statistical analysis, Students ‘t’ test was used. Data were expressed as mean ± standard deviation. Mann-Wittney ‘U’ test and Pearsons correlation co-efficient was used to compare the correlations between variables.
Results
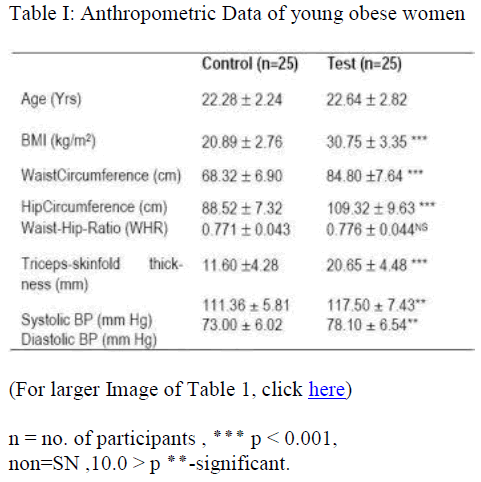
Anthropometric data of the subjects are given in Table I. A significant increase in BMI, waist circumference, hip circumference and skinfold thickness was observed in the obese group. How-ever WHR was not found to be statistically significant. Table I also shows the Blood Pressure measurements. Significant increase in the both the Systolic Blood Pressure (SBP) and Dia-stolic Blood Pressure (DBP) was observed in the obese group. Correlation studies showed a positive association of anthropmetric data viz. BMI, WC, and HC with DBP (r = 0.528; 0.538; 0.537 respectively)
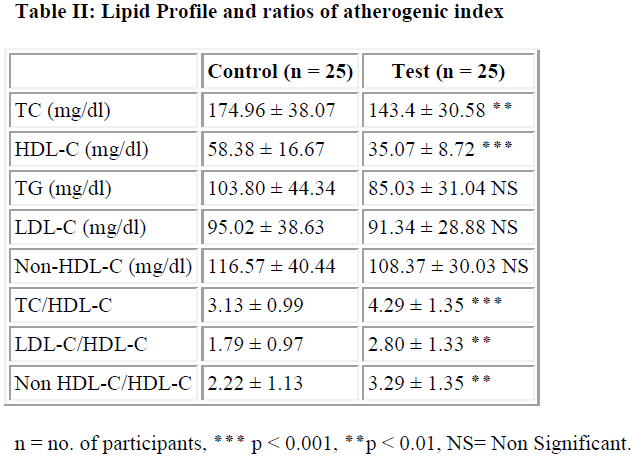
Values of the lipid parameters are given in Table II. Most impor-tant finding was a significant decrease in HDL-C levels in the test group. Paradoxically TC was also found to be lesser in the test group. Atherogenic index calcula ted by using three different ratios also shows a significant increase in the test group. There was no statistically significant difference between the mean values of TG, LDC -C or Non HDL-C of the two groups. Like wise glucose and fibrinogen levels also did not differ significantly (Table III).
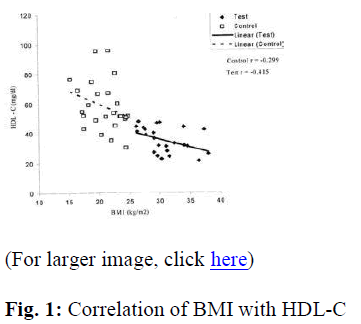
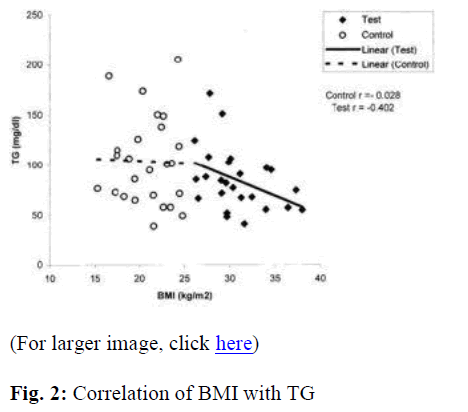
A significant negative correlation of BMI with HDL–C and TG (r = -0.415; -0.402 respectively) was observed in the test group (Figure 1 & 2). However, WC, HC and WHR showed no significant correlations in both the groups. Triceps measurement showed a significant positive association with fibrinogen only for the control group (r = 0.482).
Multiple correlations also indicate a significant negative association of HDL-C with various anthropometric indices viz. BMI, WC and TSF (r = -0.692; -0.631; -0.534 respectively). BMI shows significant negative correlation with TC (r = -0.308) and TG (r = -0.305), while a positive correlation was observed between BMI and the three ratios of atherogenic index measured, viz. TC/ HDL-C; LDL/ HDL-C; Non HDL/ HDL-C (r= 0.437; 0.443; 0.437 respectively). A significant positive association of BMI and WC with DBP was also observed (r = 0.425; 0.477 respectively).
Discussion
BMI is a relative weight index that shows highest correlation with independent measures of body fat. There are numerous reports suggesting that BMI values greater than 26 for women are associated with increased risk of fatal and non fatal coronary heart disease, NIDDM and a rise in all-cause mortality rates [12-14]. In the present study BMI of the obese group showed a 47% rise over that of the controls. Most important finding was a significant reduction in HDL-C levels of the obese group. Women with low levels of HDL-C have almost three-fold increase in CVD deaths. Even those with elevated levels of TC or LDL-C are protected from cardiovascular deaths due to high HDL-C levels. Studies by Brunner et al [15] have demonstrated a two fold greater risk of CVD in women whose HDL-C levels were less than 23% of TC levels. The present study shows HDL-C levels to be as low as 24% of TC in the test subjects and 33% of TC in the controls, indicating that the risk of CVD is marginal. A significant negative correlation of HDL-C with BMI seen in the present study group is consistent with findings of Rabkin et al [16] in men and women aged 18-74 years. Hoffman et al [12] have reported a positive correlation of TC and TG with BMI. On the contrary our studies showed a negative association of TC and TG with BMI in this age group. An increase in TC levels among the controls could be attributed mostly/partly to higher levels of HDL-C found in them.
Even though there was a statistically significant increase in TC levels the values were well within the normal range.
WC reflects the proportion of body fat located intra-abdominally and is the best indicator of changes in Intra-abdominal fat (IAF) during weight loss [17]. The WC relates closely to BMI and is also the dominant measure in the WHR. Studies by Pouliot et al [18] suggest that WC is superior to WHR in providing assessment of abdominal obesity and related metabolic complications. A negative correlation of HDL-C with WC has also been re-ported by Jacob et al [19]. In our study WC showed a negative correlation with HDL-C and with atherogenic indices. Hip circumference also showed a negative correlation with HDL-C and TC for the overall group but the association was weaker when compared with BMI and WC. TSF showed a twofold increase in the test group.
All the three measures of anthropometry i.e. (BMI, WC, HC) showed significant positive correlation with diastolic BP while, HC showed positive correlations with systolic as well as diastolic BP. This finding is also in agreement with the reports of Rabkin et al [16].
Plasma fibrinogen concentrations have been implicated in the onset and cause of ischemic heart disease in obesity [20]. No significant difference in values between the two groups have been observed in the present study suggesting that, women of this age group are at lesser risk of IHD.
BMI correlates well with HDL-C, TG, systolic and diastolic BP. WC correlates well with HDL-C and diastolic BP, WHR only with TG and TSF only with fibrinogen. A correlation of low HDL-C levels associated with increasing BMI, seen in various ranges of age groups holds good for this age group too.
The main lipid abnormality observed in young obese subjects is reduced HDL-C levels and increased BP, both of which are risk factors for CVD. From the above results it may be concluded that, a definite relation of anthropometry to CVD risk factors does exist. Simple data like BMI is a good predictor of CVD risk. But a combination of BMI with WC and TSF should be used for screening obese individuals for early detection, while determina-tion of HDL-C is certainly more useful in evaluation of CVD risk.
HDL-C levels are known to be lower in perimenopausal women, which is due to the reduced oestrogen levels. Future studies that would estimate the oestrogen levels in young obese women may yield more valuable information.
References
- Krotkiewski M, Bjorntorp P, Sjostrom L, Smith U. Impact of obesity on metabolism in men and women (Importance of regional adipose tissue). J Clin Invest 1983; 72: 1150-1162.
- Larsson B, Svarsudd K, Welin L, Wilhelmsen L, Bjorntorp P, Tibblin G. Abdominal adipose tissue distribution, obesity and risk of cardiovascular disease and death: 13-y follow up of the participants in the study of the men born in 1913. Br Med J 1984; 288: 1401-1404.
- Lapidus B, Bengtsson C, Larsson B, Pennert K, Rybo E, Sjostrom L. Distribution of adipose tissue and risk of cardiovascular disease and death: A 12-year follow up of partici-pants in the population study of women in Gothenburg, Swe-den. Br Med J 1984; 289: 1257-1260.
- Caterson ID. Obesity, Part of the metabolic syndrome. The clinical biochemist reviews 1997; 18: 11-21.
- Grundy SM. Non-high Density lipoprotein cholesterol level as potential risk predictor and therapy target. Arch Intern Med 2001; 161: 1379-1380.
- Bray GA. Predicting obesity in adults from childhood and adolescent weight. Am J Clin Nutr 2002; 76: 497-498.
- Allain CC, Poon LS, Chan CSG, Richmond W, Fu PC. Enzymatic determination of total cholesterol. Clin. chem. 1974; 20: 470-475.
- Burnstein, Scholnick M. Lipoprotein MR, Lipoproteinmetal interactions. Adv Lipid Res 1973; 11: 67-108.
- Werner M, Gabrielson DG, Eastman G. Ultramicro determination of serum triglycerides by bioluminescent assays Clin chem 1981; 27: 268-271.
- Bucolo G, David H. Quantitative determination of serum Triglycerides by the use of enzymes. Clin chem 1973; 19: 476-482.
- Varley H, Gowenlock A.H, Bell M. Determination of plasma fibrinogen, Biuret method: In Practical Clinical Biochemistry. 5th ed Vol 1. London. Heinemann Professional Pub.Ltd. 1991.
- Hoffmans AF, Kromhout D, Coulander de LC. Body Mass Index at the age of 18 and its effects on 32-year mortality from coronary heart disease and cancer. J Clin Epidemiol 1989; 42: 513-520.
- Holbrook TL, Wingerd DL, Barrett-connor E. Sex specific vs. unisex body mass indices as predictors of non-insulin dependent diabetes mellitus in older adults. Int J Obes 1990; 14: 803-807.
- Manson JE, Colditz GA, Stampfer MJ, Willet WG, Rosner B, Monson RR, Speizer FE, Hennekens CH. A prospective study of obesity and risk of coronary heart disease in women. New Eng J Med 1990; 322: 882-9.
- Brunner D, Weisbort J, Meshulam N, et al. Relation of serum total cholesterol and highdensity lipoprotein cholesterol percentage to the incidence of definite coronary events: 20-y follow up of the Donolo-Tel Aviv Prospective Coronary Artery Disease Study. The Am J Cardiol 1987; 59: 1271-76.
- Rabkin SW, Chen Y, Leiter L, Liu L, Reeder BA. Risk factor correlates of Body Mass Index: Canadian Heart Health Surveys Research Group. Can Med Assoc J 1997; 157: (Suppl 1): S26-S31.
- Vander Kooy K, Deenen R, Scidell JC. Deuremberg P, Hautvast GAJ. Effect of a weight cycle on visceral fat accumulation. Am J Clin Nutr 1993; 5: 853-7.
- Pouliot MC, Despre?s JP, Lemieux S, Moorjani S, Bouchard C, Tremblay A, Nadeau A, Lupien PJ. Waist circumference and abdominal saggital diameter: Best simple anthropometric indexes of abdominal visceral adipose tissue accumulation and related cardiovascular risk in men and women. The Am J Cardiol 1994; 73: 460-68.
- Siedell JC, Perusse L, Despres JP, Bouchard C. Waist and Hip circumferences have independent and opposite effects on cardiovascular disease risk factors: The Quebec Family Study. .Am J clin Nutr 2001; 74: 315-321.
- Meade TW, Charkrabarthi R, Haynes AP, North WRS, Stirling Y. Characteristics affecting fibrinolytic activity and Plasma fibrinogen concentrations. Br Med J 1979; 1: 152.


