ISSN: 0970-938X (Print) | 0976-1683 (Electronic)
Biomedical Research
An International Journal of Medical Sciences
- Biomedical Research (2014) Volume 25, Issue 3
Serum MMP-2, MMP-9, TIMP-1 and TIMP-2 levels in multiple sclerosis clinical subtypes and their diagnostic value in the progressive disease course.
1Department of Neurology, Sakarya University Education and Research Hospital, Sakarya, TURKEY
2Department of Neurology, Ankara Numune Education and Research Hospital, Ankara, TURKEY
3Department of Neurology, Ankara Dışkapı Education and Research Hospital, Ankara, TURKEY
4Department of Neurology, Sakarya Yenikent Government Hospital, Sakarya, TURKEY
- *Corresponding Author:
- Bilgehan Atılgan ACAR
Arabacıalanı Mahallesi
520. Sokak No:18
Serdivan/SAKARYA, TURKEY
Accepted date: February 16 2014
In multiple sclerosis (MS), a group of matrix metalloproteinases (MMPs) and their natural tissue inhibitors of metalloproteinases (TIMPs) may play a role in preventing tissue damage. The aim of this study was to determine the correlation between the MMP-9, MMP-2, TIMP- 1, and TIMP-2 serum levels and the possible relationship to the type, severity, and progressive course of MS. Eighty-nine patients and 22 healthy volunteers were enrolled in the study. The MS patients were grouped as follows: 35 relapsing-remitting patients with shortdisease- duration (RRMS-SDD) (≤5 years), 23 patients with longer-disease-duration (RRMSLDD) (≥10 years), 21 secondary progressive patients (SPMS), 6 progressive relapsing patients (PRMS) and 4 primary progressive patients (PPMS). Serum levels were analysed by ELISA. Compared with the Control Group, the TIMP-1 serum levels (ng/ml) increased [Group I (RRMS-SDD), 2242.2; Group II (RRMS-LDD), 3108.3; Group III (SPMS), 3108.3; Group IV (PRMS), 3552.3; Group V (PPMS), 2068.6; and Group VI (control group), 1554.9] (p<0.01), and the MMP-9/TIMP-1 ratios decreased [Group I, 0.074; Group II, 0.055; Group III, 0.043; Group IV, 0.028; Group V, 0.116; and Group VI, 0.107] (p<0.05) in all patient groups except the PPMS group. We re-classified the patients to reflect the progressive disease course as non-progressive (all RRMS) and progressive (PPMS, SPMS, and PRMS) groups. Compared with the control group, we again found an increase in TIMP-1 serum levels (ng/ml) [Groups I-II (RRMS=SDD and LDD), 2726.6; Groups III-IV-V (SPMS, PRMS, and PPMS), 3100.9; and Group VI (control group), 1554.9] (p<0.001) and a decrease in the MMP-9/TIMP-1 ratios [Groups I-II, 0.064; Groups III-IV-V, 0.046; and Group VI, 0.107] (p<0.01). In our study, the MMP-2, MMP-9, TIMP-2 serum levels and MMP- 2/TIMP-2 ratio were not significantly different between the groups altough reclassification. These results mirror the clinical stability that is related to the disease remission status of our patient sample. Further clinical trials will be necessary to examine potential drug targets to prevent patient attacks involving this dynamic pathophysiologic process of MS.
Keywords
Multiple sclerosis subtypes, Progressive Course, MMP-2, MMP-9, TIMP-1, TIMP-2
Background and purpose
Multiple sclerosis (MS) is a chronic inflammatory, demyelinating and neurodegenerative disease of the central nervous system (CNS). The pathophysiology of multiple sclerosis is a dynamic process involving concomitant damage and repair mechanisms. It is believed that autoimmune mechanisms, triggered by environmental factors, contribute to MS in genetically susceptible individuals. The pathogenesis of MS is known to be comprised of blood-brain barrier (BBB) degradation and trans-migration of T-lymphocytes into the CNS [1-3].
The entrance of leukocytes into the CNS is dependent on a number of factors, and the expression of matrix metalloproteinases (MMPs) is most likely among these factors [4-6]. Th1 cells have been reported to possess enhanced migration over Th2 cells, and this enhanced migration is associated with higher MMP-2 and MMP-9 expression levels in Th1 cells when relative the migratory capabilities of the pro-inflammatory CD4+ (Cluster of differentiation 4 positive) T cells (Th1), which are involved in the pathogenesis of MS, are compared with regulatory Th2 cells [7]. Migration of leukocytes across the BBB into the CNS depends on a series of events. Selectins and integrins, the ligands that interact with endothelial cell adhesion molecules, chemokines and their receptors, and matrix metalloproteinases (MMPs) enable leukocyte migration into the CNS [8]. The degradation of the subendothelial basal membrane is required during this migration, and the MMPs are responsible for the basal membrane degradation [9].
The integrity of the extracellular matrix is maintained through the balance of the synthesis and proteolysis of its components, and this process is primarily carried out by MMPs and their tissue inhibitors (TIMP). MMPs are considered to be physiological mediators that enable cell migration through various barriers. Astrocytes, oligodendrocytes, microglia, endothelial cells, neurons and lymphocytes provide the main source of MMPs in the CNS [10].
In this study, the serum levels of MMP-2, MMP-9, TIMP- 1, TIMP-2 and the ratio of MMP-9/TIMP-1 and MMP- 2/TIMP-2 were characterised as biomarkers and correlated with their activity and MS subtype.
Patients and Methods
This study, conducted in the neurology unit of the Ankara Dışkapı Yıldırım Beyazıt Training and Research Hospital between January 2008 and February 2013, consisted of 89 MS patients and 22 healthy control subjects. The inclusion criteria were: age between 15 and 60 years old, confirmed MS according to McDonald’s diagnostic criteria (2010 revision), and a remission period of at least two months. The study’s exclusion criteria were: MS coexisting with any other systemic or CNS disease and receiving medical treatment for any infectious disease within the two months prior to study enrolment.
The serum of 89 MS patients (30 men and 59 women) and 22 healthy control subjects were examined. The youngest patient was 17, and the oldest patient was 58 years old. Patients with MS were divided into subgroups according to their MS types as RRMS, SPMS, PRMS and PPMS. Patients with RRMS were separated into two groups: patients with a disease duration of 5 years or less [RRMSShort Disease Duration (RRMS-SDD)] and patients with a disease duration of 10 years or longer [RRMS-Long Disease Duration (RRMS-LDD)]. The control group consisted of 22 healthy individuals (aged 17 to 48 years old) and gender-matched volunteers (6 men and 16 women), who did not have a previous history of systemic or CNS disease. Subjects with an active infection or who received any medical treatment were excluded from the analyses to avoid any interference from medical treatments and biological variables.
Clinical evaluation of the patients was performed using the Kurtzke Expanded Disability Status Scale (EDSS). Serum samples were obtained from patients, centrifuged and stored at -80°C. Venous blood samples obtained from the 22 healthy control subjects were stored at -80°C immediately after centrifugation. MS patient and control samples were brought to room temperature along with all reagents, and the samples were analysed using an Enzyme Linked-Immuno-Sorbent Assay (ELISA).
The study protocol was approved by the Ethics Committee of the Ankara Dışkapı Yıldırım Beyazıt Training and Research Hospital, and written informed consent was obtained from each participant.
Analysis of the MMP-9, TIMP-1, and TIMP-2 expression levels
The following expression levels were analysed according to the manufacturers’ instructions: human MMP-9, TIMP- 1, and TIMP-2 ELISA Kits (RayBiotech, Inc., Norcross, GA, USA) ; an MMP-9 ELISA Kit, which is a sandwich ELISA based kit designed specifically to measure MMP-9 in suspended or adherent human cells; a human TIMP-1 sandwich ELISA; a non-isotopic human TIMP-1 colorimetric in vitro assay for tissue culture media or serum; a human TIMP-2 sandwich ELISA based kit; and a nonisotopic in vitro TIMP-2 immunoassay in tissue culture medium, serum, plasma and tissue lysates. Reagents and patient samples were warmed to room temperature. After adding standards and 100 μl of sample into all microwells and incubating at room temperature for 2.5 hours, 100 μl of a biotin antibody were added to all wells and incubated at room temperature for 1 hour. After the addition of 100 μl of streptavidin solution, the samples were incubated at room temperature for 45 minutes. 100 μl of TMB One-Step Substrate solution was added, and the samples were incubated at room temperature for 30 minutes. Stop solution (50 μl) was added, and the absorbance values were acquired with an automated ELISA micro-plate reader at a wavelength of 450 nm.
Analysis of MMP-2
The MMP-2 expression levels were analysed according to the following manufacturers’ instructions: total MMP-2 (R&D Systems Quantikine® Human/Mouse/Rat MMP-2, MN, USA) and a non-isotopic colorimetric human MMP- 2 ELISA kit for tissue culture media, serum, or plasma (Catalog Number QIA63, Calbiochem, San Diego, USA). The reagents and samples obtained from patients were warmed to room temperature and prepared in polypropylene test tubes. Assay Diluent RD1-74 (100 μl) was added to all wells followed by 50 μl of standard. The microwells were covered with adhesive strips, incubated for 2 hours at room temperature using a horizontal micro-plate shaker, and then washed 4 times by aspiration. After washing, 200 μl of conjugate were added to all microwells, incubated in a shaker for 2 hours, and then washed 4 times by aspiration. Next, 200 μl of substrate solution were added to each well and incubated for 30 minutes in the dark. Finally, 50 μl of stop solution were added to all wells, and within 30 minutes, the absorbance values of the micro-wells were obtained at a wavelength of 450 nm.
Statistics
Data were analysed using the Statistical Package for the Social Sciences (SPSS) 11.5 program for Windows. Descriptive statistics were expressed as follows: for age, mean ± standard deviation; for disease duration, median (minimum-maximum); and for the EDSS, MMP-2, MMP- 9, TIMP-1, TIMP-2, MMP-2/TIMP-2 and MMP-9/TIMP- 1 levels, median (25-75) percentile. The average age among the groups was evaluated with a One-Way Analysis of Variance and a Tukey post hoc test, and the median expression levels of EDSS, MMP-2, MMP-9, TIMP-1, TIMP-2, MMP-2/TIMP-2 and MMP-9/TIMP-1 for disease duration were analysed with the Kruskal-Wallis test followed by a Conover’s multiple comparison post hoc test. The median disease duration and the EDSS of Groups I-II and Groups III-IV-V were compared with the Mann Whitney U test. To determine whether the gender distribution of the groups was homogeneous, the groups were compared with the Pearson's chi-square test. Statistical significance was set at p<0.05.
Results
The patients were separated into the following groups: Group I (RRMS-SDD), Group II (RRMS-LDD), Group III (SPMS), Group IV (PRMS), Group V (PPMS), and Group VI (healthy controls).
There were 35 patients in Group I, 23 patients in Group II, 21 patients in Group III, 6 patients in Group IV, 4 patients in Group V and 22 healthy controls in Group VI.
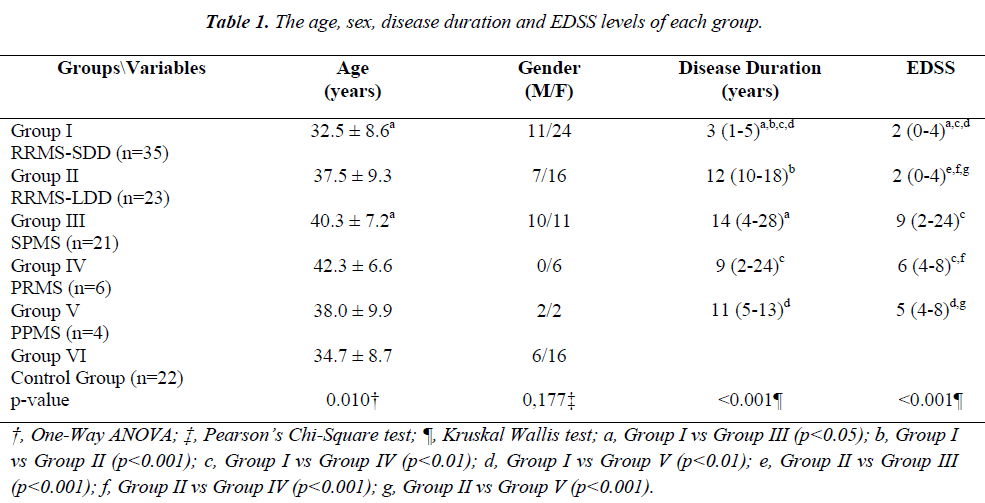
The age, gender, disease duration and EDSS levels of each group are presented in Table 1.
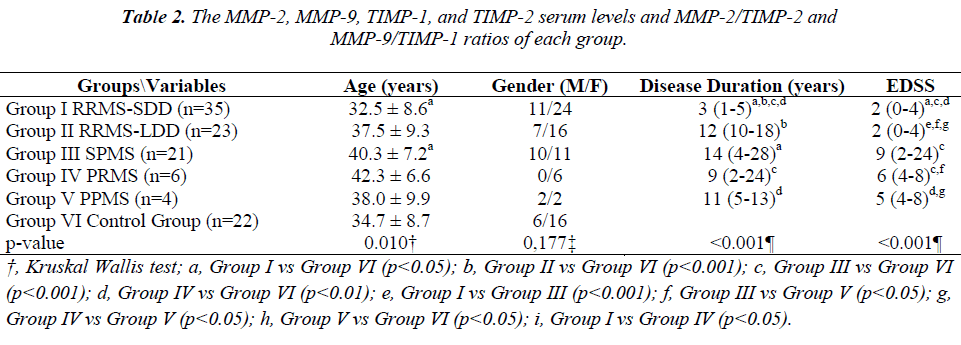
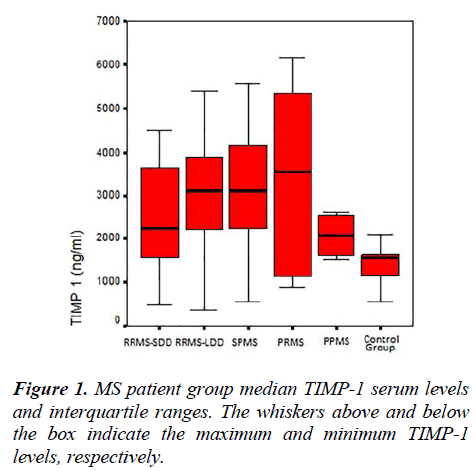
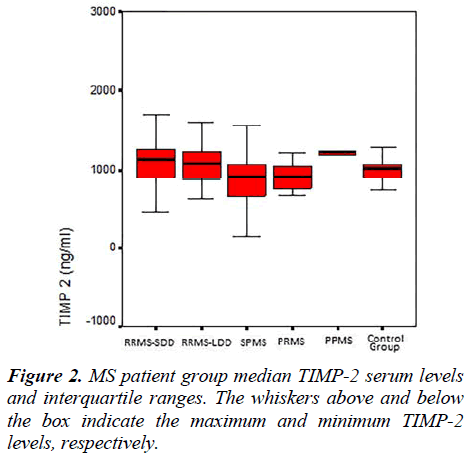
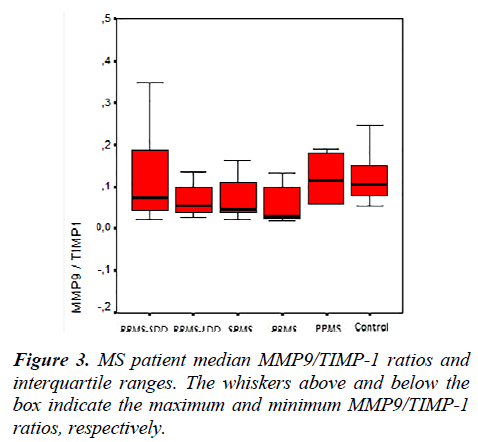
The MMP-2, MMP-9, TIMP-1, TIMP-2 serum levels and the MMP-2/TIMP-2, MMP-9/TIMP-1 ratios of each group are presented in Table 2. Figures 1, 2 and 3 show the TIMP-1 serum levels, TIMP-2 serum levels, and MMP9/TIMP-1 ratios of each group, respectively.
No statistically significant differences were found between Groups I and II except for the disease duration (Conover’s Multiple Comparison test, p<0.001). Statistically significant differences were observed between the EDSS scores of Groups I and II when compared with the other patient groups (Conover’s Multiple Comparison test, p<0.05).
The average age was 34.5 ± 9.2 in Groups I-II, 40.4 ± 7.3 in Groups III-V and 34.7 ± 8.7 in Group VI. The age differences between Groups I-II and Groups III-V and between Groups III-V and Group VI were statistically significant (p<0.05). The gender distribution (male/female ratio) was 18/40 in Groups I-II, 12/19 in Groups III-V and 6/16 in Group VI, and no statistically significant differences were detected between the groups (p=0.645). The median disease duration was 5 (1 to 18) years in Groups I-II and 12 (2 to 28) years in Groups III-V, and the difference in disease the median disease duration between the groups was statistically significant (p<0.001).
The age, gender, disease duration and EDSS levels of each group, re-classified according to disease progression, are presented in Table 3. The median EDSS values were 2 (0 to 4) in Groups I-II and 4 (3 to 9) in Groups III-V, and the difference between the groups was statistically significant (p<0.001).
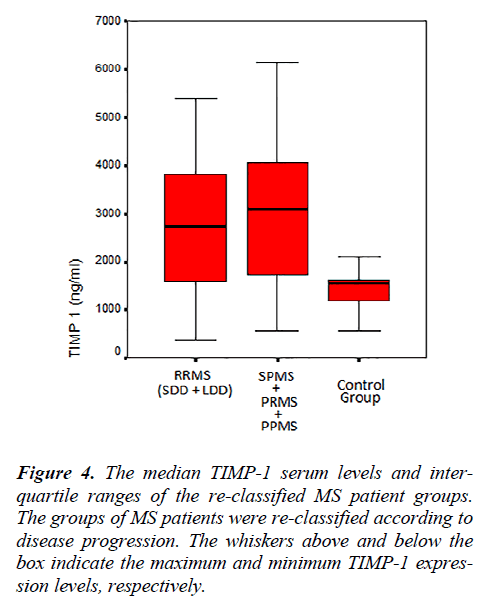
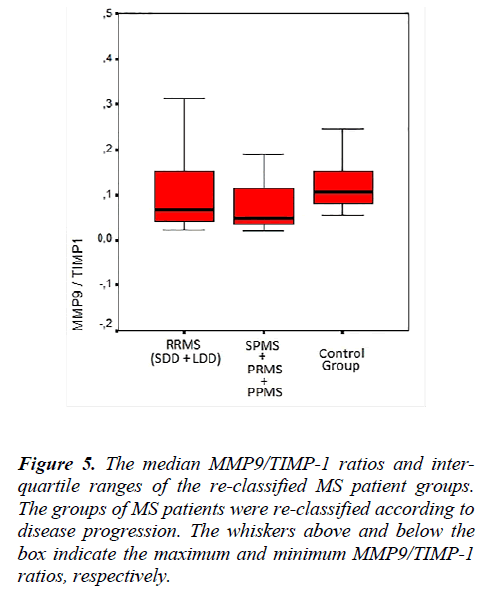
The MMP-2, MMP-9, TIMP-1, TIMP-2 serum levels and the MMP-2/TIMP-2, MMP-9/TIMP-1 ratios of each group, re-classified according to disease progression, are shown in Table 4. Figure 4 shows the TIMP-1 serum levels the re-classified groups, and Figure 5 shows the MMP9/TIMP-1 ratios of the re-classified groups.
Discussion
Reliable biomarkers to evaluate the activity and MS subtype or to provide information about the clinical prognosis and pathophysiological disease process are still lacking [11-14]. Although MMPs are not the only factors responsible for the pathophysiology of MS, they may be important in evaluating the clinical subtype and disease activity. This study hypothesised that MMP-9 and MMP- 2 and their tissue inhibitors TIMP-1 and TIMP-2 are involved in MS pathogenesis and set out to investigate if these factors differ in the clinical disease subtypes and indisease progression. The study design was based on previously published work [11].
MMPs have been shown to play a role in active disease exacerbation [12], and MMP-9 expression was observed in acute MS lesions, macrophages, astrocytes, and in white matter perivascular mononuclear cells [15,16]. Various studies of serum and cerebrospinal fluid MMP levels have also been conducted. The majority of these studies have focused on MMP-9, which can easily be detected and measured using gelatin zymography and ELISA from several commercial sources [17]. The increased MMP-9 levels in the cerebrospinal fluid (CSF) of MS patients were associated with BBB damage and gadolinium involvement in contrast-enhanced MRI. Methylprednisolone therapy has been reported to reduce gadolinium involvement as well as the MMP-9 levels in CSF by preventing MMP transcription [18]. However, while increased MMP-9 levels were detected in all patients with RRMS, a ratio of 57% in the CSF was reported in patients with PPMS [19]. Furthermore, several studies have shown that interferon-β therapy caused a decrease in MMP-9 serum levels and MMP-9 mRNA in MS patients [13,20].
Conflicting results from a limited number of studies suggest that MMP-2 can serve as a biomarker for the different MS subtypes. High levels of MMP-2 in progressive MS have been reported to be responsible for the inflammation and disease suppressive effects. However, the role of MMP-2 in the chronic disease process, tissue repair [21], neuronal death [22] and axonal death [23] has already been demonstrated.
In our study, the MMP-9 and MMP-2 serum levels were not significantly different between the groups. Our admission criteria of current remission and no active infection or medical treatment could be a possible cause for the lack of increased MMP-9, as previously discussed in the literature, during the formation of MS lesions [24,25].
While MMP-9 is normally up-regulated during inflammatory conditions, MMP-2 is primarily expressed in the brain [5]. The overexpression of MMP-2 may produce a protective effect in MS but can also be damaging. In contrast, MMP-2, which causes myelin and/or axonal damage through the penetration of CD4+ Th1 cells and macrophages across the BBB, can also increase tissue repair [17,26]. Previous studies have produced conflicting results when examining the MMP-2 levels in CSF, serum and neuropathological conditions in acute and chronic demyelinating lesions [27]. Compared with the control group, the MMP-2 expression levels in MS patients were found to increase, decrease or remain unchanged in CSF [19,27-30], serum [29,31] and peripheral blood mononuclear cells [7,32,33]. Because the “active-MMP-2” possesses catalytic activity and is responsible for its effects, the inability of the previously used methods (immunohistochemistry, zymography, in situ hybridisation, polymerase chain reaction, flow cytometry and ELISA) to detect active enzyme may explain the observed variability across different studies. Our study used an ELISA method to measure the MMP-2, MMP-9, TIMP-1 and TIMP-2 serum levels.
In another study, the brain tissues of MS patients were examined immuno-histopathologically, and TIMP-1 was detected in regions with MMP-9 reactivity; however, no comparison with the control group was performed [15]. While the serum TIMP-1 levels were not statistically different between the MS groups in our study, the TIMP-1 serum levels of the RRMS-SDD, RRMS-LDD, SPMS and PRMS groups were increased compared with the healthy control group. The absence of this difference in PPMS patients may be due to the small sample size (n=4).
Moreover, in a recent study [14], a significant decrease in the serum TIMP-2 levels and an increase in the MMP- 2/TIMP-2 ratio were detected when PPMS patients were compared with RRMS patients. The decrease in serum TIMP levels caused the MMP/TIMP ratio to increase and the subsequent increase in MMP activity. In our study, the TIMP-2 serum levels of the RRMS-SDD group were increased compared with the SPMS and control groups. In the SPMS group, these TIMP-2 serum levels were significantly lower than the PRMS, PPMS and control group levels. After activation, MMPs can be regulated by establishing tight, 1:1 non-covalent complexes with TIMPs [34]. The MMP/TIMP balance reflects the net proteolytic activity present in several physiological processes.
Lichtinghagen et al. [35] reported a higher MMP-9/TIMP- 1 ratio in the active MS group than in the control group, which is consistent with higher proteolytic activity in MS patients. Avolio et al. [11] showed that the serum MMP- 9/TIMP-1 ratio in RRMS patients was higher than the ratio in PPMS patients; however, the inverse was observed for the MMP-2/TIMP-2 ratio. The increased MMP-2/TIMP-2 ratio was interpreted as characteristic of chronic disease progression and the higher MMP- 9/TIMP-1 ratio as progressing relapsing/remitting disease. The MMP-9 and TIMP-1 expression levels in MS are still controversial, but the relationship between a higher MMP-9/TIMP-1 ratio and lesion formation with new Gd involvement has been emphasised in various studies [36].
Galboitz et al. [13] reported increased MMP-2 expression in RRMS patients when comparing 16 RRMS patients to 12 SPMS patients. In our study, the MMP-2/TIMP-2 ratios were similar in all groups examined. The MMP- 9/TIMP-1 ratio of the RRMS-SDD group was higher than the ratio of the PRMS group. Additionally, in the PRMS group, the MMP-9/TIMP-1 ratio was lower compared with the PPMS group. Furthermore, when compared with the control group, this ratio was lower in all the RRMSSDD, RRMS-LDD, SPMS and PRMS groups, which particularly attracted our attention. The small sample size of the PPMS patients examined can explain the lack of significant differences when compared to the control group.
In this study, the MS patient groups were re-classified by the progressive disease course. With this new classification scheme, no statistically significant differences were observed in the MMP-2, MMP-9 and TIMP-2 serum levels. Although the TIMP-1 serum levels of the RRMS and SPMS-PRMS-PPMS groups were similar, the serum levels of these groups were increased compared with the control group.
In summary, the TIMP-1 serum levels were increased in all MS patients compared with the control group. This observation was remarkable and in contrast to previous reports. While the MMP-2/TIMP-2 ratios were similar between the groups, the MMP-9/TIMP-1 ratios were similar between the groups but decreased in the RRMS and SPMS-PRMS-PPMS patient groups compared with the control group. The decrease of the MMP-9/TIMP-1 ratio was a result of the increased TIMP-1 serum levels.
Conclusions
In all MS subgroups compared with the control group, the TIMP-1 levels were increased, and the MMP-9/TIMP-1 ratios were decreased, except for the PPMS group due to a small sample size (n=4). The increase of MMP-9 expression levels during the active formation of MS lesions has been emphasised in numerous studies. However, when the repair process is initiated, TIMP production may increase to create a normal MMP/TIMP ratio and to regain BBB integrity by decreasing activated T cell migration. Our findings correlate with the clinical stability of our patients. To investigate potential drug targets to prevent patient attacks, further clinical trials should be initiated to examine this dynamic pathophysiologic process of MS.
References
- Keegan BM, Noseworthy JH. Multiple sclerosis. Annu Rev Med. 2002; 53: 285-302.
- Bar-Or A, Oliveira EM, Anderson DE, Hafler DA. Molecular pathogenesis of multiple sclerosis. J Neuroimmunol. 1999 Dec; 100(1-2): 252-259.
- Compston A. The pathogenesis and basis for treatment in multiple sclerosis. Clin Neurol Neurosurg. 2004 Jun; 106(3): 246-248.
- Hartung HP, Kieseier BC. The role of matrix metalloproteinases in autoimmune damage to the central and peripheral nervous system. J Neuroimmunol. 2000 Jul 24; 107(2): 140-147.
- Rosenberg GA. Matrix metalloproteinases and neuroinflammation in multiple sclerosis. Neuroscientist 2002 Dec; 8(6): 586-595.
- Yong VW, Power C, Forsyth P, Edwards DR. Metalloproteinases in biology and pathology of the nervous system. Nat Rev Neurosci. 2001 Jul; 2(7): 502-511.
- Abraham M, Shapiro S, Karni A, Weiner HL, Miller A. Gelatinases (MMP-2 and MMP-9) are preferentially expressed by Thl vs. Th2 cells. J Neuroimmunol. 2005 Jun; 163(1-2): 157-164.
- Ozenci V, Kouwenhoven M, et al. Multiple sclerosis: Pro- and anti-inflammatory cytokines and metalloproteinases are affected differentially by treatment with IFN-β. J Neuroimmunol. 2000 Aug 1; 108(1-2): 236-243.
- Man S, Ubogu EE, Ransohoff RM. Inflammatory cell migration into the central nervous system: a few new twists on the old tale. Brain Pathol. 2007 Apr; 17(2): 243-250.
- Chandler S, Miller KM, Clements JM, Lury J, Corkill D, Anthony DC, Adams SE, Gearing AJ. Matrix metalloproteinases, tumor necrosis factor and multiple sclerosis: an overview. J Neuroimmunol. 1997 Feb; 72(2): 155-161.
- Avolio C, Ruggieri M, Giuliani F, Liuzzi GM, Leante R, Riccio P, Livrea P, Trojano M. Serum MMP-2 and MMP-9 are elevated in different multiple sclerosis subtypes. J Neuroimmunol. 2003 Mar; 136(1-2): 46-53.
- Kanesaka T, Mori M, Hattori T, Oki T, Kuwabara S. Serum matrix metalloproteinase-3 levels correlate with disease activity in relapsing-remitting multiple sclerosis. J Neurol Neurosurg Psychiatry. 2006 Feb; 77(2): 185-188.
- Galboiz Y, Shapiro S, Lahat N, Rawashdeh H, MillerMatrix metalloproteinases and their tissue inhibitors as markers of disease subtype and response to interferon-beta therapy in relapsing and secondary-progressive multiple sclerosis patients. Ann Neurol. 2001 Oct; 50(4): 443-451.
- Benesová Y, Vasku A, Novotná H, Litzman J, Stourac P, Beránek M, Kadanka Z, Bednarík J. Matrix metalloproteinase-9 and matrix metalloproteinase-2 as biomarkers of various courses in multiple sclerosis. Mult Scler. 2009 Mar; 15(3): 316-322.
- Cuzner ML, Gveric D, Strand,C, Loughlin AJ, Paemen L, Opdenakker G, Newcombe J. The expression of tissue-type plasminogen activator, matrix metalloproteinases and endogenous inhibitors in the central nervous system in multiple sclerosis: comparison of stages in lesion evolution. J Neuropathol Exp. Neurol. 1996 Dec; 55(12), 1194-1204.
- Maeda A, Sobel RA. Matrix metalloproteinases in the normal human central nervous system, microglial nodules, and multiple sclerosis lesions. J Neuropathol Exp Neurol. 1996 Mar; 55(3): 300-309.
- Yong VW, Zabad RK, Agrawal S, Goncalves Dasilva A, Metz LM. Elevation of matrix metalloproteinases (MMPs) in multiple sclerosis and impact of immunomodulators. J Neurol Sci. 2007 Aug 15; 259(1-2): 79-84.
- Rosenberg GA, Dencoff JE, Correa N Jr, Reiners M, Ford CC. Effect of steroids on CSF matrix metalloproteinases in multiple sclerosis: relation to blood-brain barrier injury. Neurology. 1996 Jun; 46(6): 1626-1632.
- Leppert D, Ford J, Stabler G, et al. Matrix metalloproteinase-9 (gelatinase B) is selectively elevated in CSF during relapses and stable phases of multiple sclerosis. Brain 1998 Dec; 121 (Pt 12): 2327-2334.
- Yushchenko M, Mäder M, Elitok E, Bitsch A, Dressel A, Tumani H, Bogumil T, Kitze B, Poser S, Weber F. Interferon-beta-1 b decreased matrix metalloproteinase-9 serum levels in primary progressive multiple sclerosis. J Neurol. 2003 Oct; 250(10): 1224-1228.
- Bever CT Jr, Rosenberg GA. Matrix metalloproteinases in multiple sclerosis: targets of therapy or markers of injury? Neurology. 1999 Oct 22; 53(7): 1380-1381.
- Johnson KP, Brooks BR, Cohen JA, Ford CC, Goldstein J, et al. Copolymer 1 Multiple Sclerosis Study Group. Extended use of glatiramer acetate (Copaxone) is well tolerated and maintains its clinical effect on multiple sclerosis relapse rate and degree of disability. 1998 [classical article]. Neurology. 2001 Dec; 57(12 Suppl 5): S46-53.
- Newman TA, Woolley ST, Hughes PM, Sibson NR, Anthony DC, Perry VH. T-cell- and macrophagemediated axon damage in the absence of a CNSspecific immune response: involvement of metalloproteinases. Brain. 2001 Nov; 121(Pt 11): 2203-2214.
- Waubant E, Goodkin DE, Gee L, Bacchetti P, Sloan R, Stewart T, et al. Serum MMP-9 and TIMP-1 levels are related to MRI activity in relapsing multiple sclerosis. Neurology. 1999 Oct; 53(7): 1397-401.
- Lee MA, Palace J, Stabler G, Ford J, Gearing A, Miller K. Serum gelatinase B, TIMP-1 and TIMP-2 levels in multiple sclerosis. A longitudinal clinical and MRI study. Brain. 1999 Feb; 122 (Pt 2): 191-197.
- Yong VW. Metalloproteinases: mediators of pathology and regeneration in the CNS. Nat Rev Neurosci. 2005 Dec; 6(12): 931-944.
- Lindberg RL, De Groot CJ, Montagne L, et al. The expression profile of matrix metalloproteinases (MMPs) and their inhibitors (TIMPs) in lesions and normal appearing white matter of multiple sclerosis. Brain. 2001 Sep; 124(Pt 9): 1743-1753.
- Rosenberg GA, Dencoff JE, Correa N Jr, Reiners M, Ford CC. Effect of steroids on CSF matrix metalloproteinases in multiple sclerosis: relation to blood-brain barrier injury. Neurology. 1996 Jun; 46(6): 1626-1632.
- Bugno M, Witek B, Bereta J, Bereta M, Edwards DR, Kordula T. Reprogramming of TIMP-1 and TIPM-3 expression profiles in brain microvascular endothelial cells and astrocytes in response to proinflammatory cytokines. FEBS Lett. 1999 Apr 1; 448(1): 9-14.
- Mandler RN, Dencoff JD, Midani F, Ford CC, Ahmed W, Rosenberg GA. Matrix metalloproteinases and tissue inhibitors of metalloproteinases in cerebrospinal fluid differ in multiple sclerosis and Devic’s neuromyelitis optica. Brain. 2001(Mar); 124(Pt 3): 493-498.
- Correale J, Bassani Molinas Mde L. Temporal variations of adhesion molecules and matrix metalloproteinases in the course of MS. J Neuroimmunol. 2003 Jul; 140(1-2): 198-209.
- Bar-Or A, Nuttall, RK, Duddy M, et al. Analyses of all matrix metalloproteinase members in leukocytes emphasize monocytes as major inflammatory mediators in multiple sclerosis. Brain. 2003 Dec; 126(Pt 12): 2738-2749.
- Kouwenhoven M, Ozenci V, Tjernlund A, et al. Monocyte-derived dendritic cells express and secrete matrixdegrading metalloproteinases and their inhibitors and are imbalanced in multiple sclerosis. J Neuroimmunol. 2002 May; 126(1-2): 161-171.
- Yong VW, Krekoski CA, Forsyth PA, Bell R, Edwards DR. Matrix metalloproteinases and diseases of the CNS. Trends Neurosci. 1998 Feb; 21(2): 75-80.
- Lichtinghagen R, Seifert T, Kracke A, Marckmann S, Wurster U, Heidenreich F. Expression of matrix metalloproteinase-9 and its inhibitors in molecular blood cells of patients with multiple sclerosis. J Neuroimmunol. 1999 Sep 1; 99(1): 19-26.
- Ichiyama T, Kajimoto M, Suenaga N, Maeba S, Matsubara T, Furukawa S. Serum levels of matrix metalloproteinase-9 and its tissue inhibitor (TIMP-1) in acute disseminated encephalomyelitis. J Neuroimmunol. 2006 Mar; 172(1-2): 182-186.
