ISSN: 0970-938X (Print) | 0976-1683 (Electronic)
Biomedical Research
An International Journal of Medical Sciences
Commentary - Biomedical Research (2017) Volume 28, Issue 20
Short term application of Pongamia pinnata enhances the collagen I expression of stem cells
Hyunjin Lee1, Md. Salah Uddin2, Yong-In Kim3, Sangho Choi3 and Jun-Beom Park1*
1Department of Periodontics, College of Medicine, the Catholic University of Korea, Seoul, Republic of Korea
2Ethnobotanical Database of Bangladesh, People's Republic of Bangladesh
3International Biological Material Research Center, Korea Research Institute of Bioscience and Biotechnology, Daejeon, Republic of Korea
- *Corresponding Author:
- Jun-Beom Park
Department of Periodontics
Seoul St Mary’s Hospital
College of Medicine
The Catholic University of Korea, Republic of Korea
Accepted on October 25, 2017
The effects of Pongamia pinnata on stem cells have rarely been tested. This study aimed to evaluate the effects of the extract of Pongamia pinnata on the morphology and proliferation potential of the human gingival stem cells. Stem cells obtained from gingiva were cultured in a growth medium in the presence of Pongamia pinnata methanolic extract (PPT) at concentrations ranging from 0.001% to 1%. Evaluation of cell morphology and cellular viability were done at d’s 1, 3, 5 and 7. Immunofluorescent assays for collagen I and Runx2 were performed on d’s 1, 3, 5 and 7. Stem cells in the control group showed fibroblast-like morphology and the morphology of stem cells in the presence of PPT did not produce any noticeable changes. Low dose of PPT produced an increase in cell proliferation by 5 to 10%. However, higher dose of PPT of 1% group produced a significant decrease in cell proliferation. Noticeable increase of collagen I expression with noted with application of PPT, especially at 0.1%. Based on these findings, it was concluded that PPT could produce beneficial effects on mesenchymal stem cells with enhanced collagen I expression.
Keywords
Cell survival, Herbal medicine, Pongamia, Stem cells.
Introduction
Medicinal herbs that have been used for thousands of years in traditional Oriental medicine are attractive sources of novel therapeutics or preventives [1-3]. They have been pre-validated for effectiveness and are expected to have fewer safety issues than chemically synthesized drugs [4]. Pongamia pinnata (L.) Pierre, commonly called as ‘Kanuga Tree,’ is a medium-sized ever green Indo-Malaysian species, commonly grown on alluvial and coastal habitats from India to Fiji, starting from sea level to 1200 m [5]. Pongamia pinnata has been used for the treatment of neurodegenerative diseases [6], skin diseases [7], and infectious diarrhea [8]. Pongamia pinnata is reported to have antioxidant activity [9], and antimicrobial activity [10].
The effects of herbal extracts on stem cells have been studied. In vitro experiments showed that an essential bioactive component extracted from the herb Epimedium promoted cell proliferation and regulated gene expression of bone marrow stem cells and neural stem cells [11-13]. Application of aromatic turmerone from the Curcuma longa herb increased the number of cultured stem cells [14]. The effects of Aloe vera (L.) Liliaceae herb on the viability of dental pulp stem cells were tested and it was shown that a significantly higher viability of stem cells was noted with application of the herbal extract [15].
However, the effects of Pongamia pinnata on stem cells have rarely been tested. Human gingival stem cells showed multipotency with high proliferation and characteristics of mesenchymal stem cells [16]. Human gingival stem cells have been applied for tissue-engineering purposes and are considered a favorable source of mesenchymal stem cells because harvesting stem cells from the mandible or maxilla may be performed with ease under local anesthesia [17]. This study aimed to evaluate the effects of the extract of Pongamia pinnata on the morphology and proliferation potential of the human gingival stem cells.
Materials and Methods
Preparation of plant materials
Pongamia pinnata (L.) Pierre was collected from Noakhali in Bangladesh by Md Salah Uddin. A voucher specimen recoded as PB022015 was deposited in the herbarium of the Korea Research Institute of Bioscience and Biotechnology. After drying and grinding the seeds of Pongamia pinnata, the powder (58 g) was added to 500 ml of methanol. The extraction was done using the method of repercolation at room temperature. The extract was filtered and concentrated by rotavapor under reduced pressure, thereby obtaining 15.04 g of Pongamia pinnata methanolic extract (PPT).
Stem cells isolated from human gingiva
The gingivae were obtained from healthy patients visiting the Department of Periodontics, Seoul St. Mary’s Hospital, College of Medicine, the Catholic University of Korea. The Institutional Review Board reviewed and approved the study (KC11SISI0348). Informed consent was obtained from the participants. All of the methods were performed in accordance with the relevant guidelines and regulations. The obtained gingivae were placed in sterile Phosphate-Buffered Saline (PBS, Welgene, Daegu, South Korea) containing 100 U/ml penicillin and 100 μg/ml streptomycin (Sigma-Aldrich Co., St. Louis, MO, USA). The epithelium of the obtained tissue was removed, and the tissue was minced into 1-2 mm fragments. The tissues were digested with media containing dispase (1 mg/ml; Sigma-Aldrich Co.) and collagenase IV (2 mg/ml; Sigma-Aldrich Co.). The cells were incubated in an environment with 5% CO2 and 95% O2 at 37°C in an incubator. Cells that were not attached to the culture dish were removed, and the media was changed every two to three days.
Evaluation of cellular morphology
The cells were plated in 96 well plates at a density of 2.0 × 10³ cells/well. The cells were incubated in the control medium (minimal essential medium (α-MEM, Gibco, Grand Island, NY, USA) supplemented with 15% Fetal Bovine Serum (FBS, Gibco), 200 mM L-glutamine (Sigma-Aldrich Co.), 10 mM of ascorbic acid 2-phosphate (Sigma-Aldrich)) in the presence of PPT at final concentrations of 0%, 0.001%, 0.01%, 0.1%, and 1%. On d’s 1, 3, 5, and 7, inverted microscopy (CKX41SF, Olympus Corporation, Tokyo, Japan) was used to evaluate the morphology of the tested stem cells.
Cellular viability
Evaluation of the viability of the cells grown in the control medium in the presence of PPT at final concentrations of 0%, 0.001%, 0.01%, 0.1%, and 1% was done on d’s 1, 3, 5, and 7 with the Counting Kit-8 (CCK-8, Dojindo, Tokyo, Japan) assay. Tetrazolium monosodium salt was added to the culture, and the cells were incubated at 37°C for 2 h. A microplate reader (BioTek Instruments Inc., Winooski, VT, USA) was used to find the spectrophotometric absorbance at 450 nm. The tests were performed in triplicate.
Immunofluorescence
An immunofluorescent assay was performed for collagen I (ab76956, Abcam, Cambridge, UK) and Runx2 (ab6308, Abcam) on D’s 1, 3, 5, and 7. The cells were fixed, permeabilized, blocked, and incubated with primary antibodies. The cultures were incubated with fluorescein isothiocyanate-conjugated secondary antibody (F2761, Abcam); then, the washed cells were stained with 4’, 6- diamidino-2-phenylindole. Analyses were performed using a fluorescence microscope (Axiovert 200, Zeiss, Jena, Germany).
Statistical analysis
The results are shown as means ± standard deviations of the experiments. A test of normality was performed, and a oneway analysis of variance with post hoc Tukey’s test was performed to determine the differences between the groups using a commercially available program (SPSS 12 for Windows, SPSS Inc., Chicago, IL, USA). The level of significance was set at 0.05.
Results
Evaluation of cell morphology
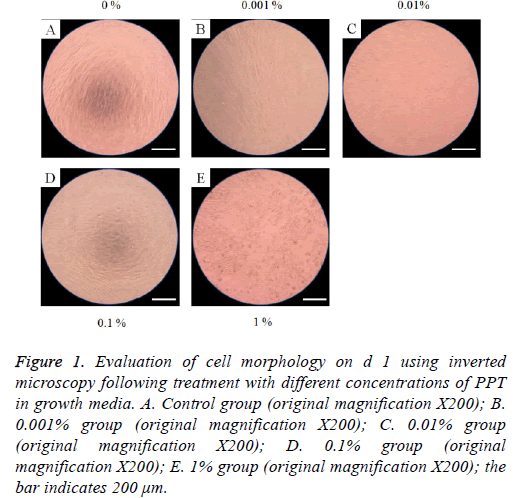
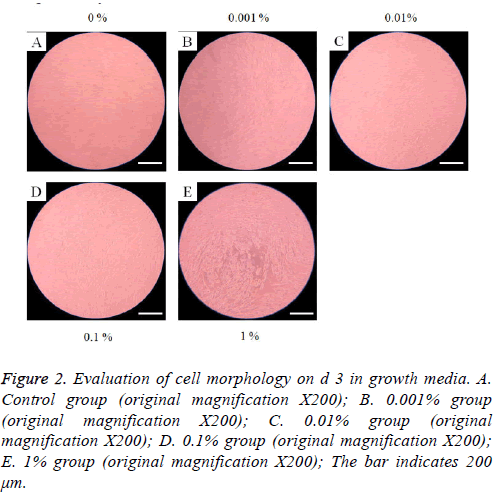
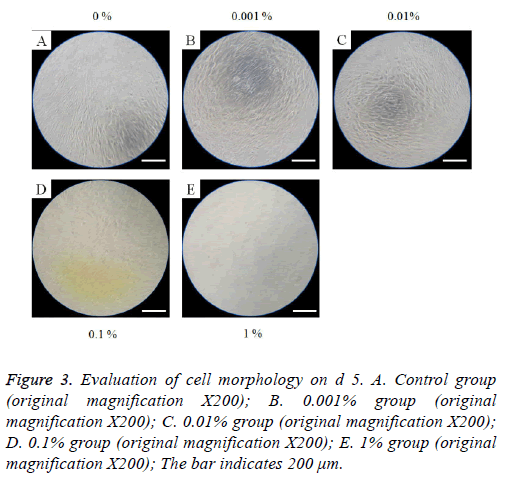
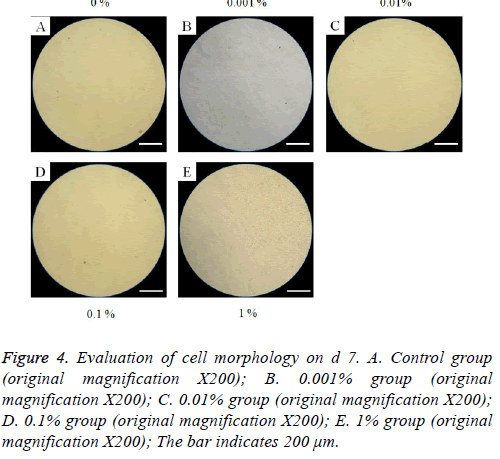
The morphology of stem cells treated with PPT at final concentrations of 0%, 0.001%, 0.01%, 0.1%, and 1% are shown in Figures 1-4. Stem cells in the control group showed fibroblast-like morphology on d 1 (Figure 1A). The morphology of stem cells in the presence of PPT at final concentrations of 0%, 0.001%, 0.01%, 0.1%, and 1% did not produce any noticeable changes when compared with the untreated control group (Figures 1B-1E). The cell morphology results for d’s 3, 5, and 7 are shown in Figures 2-4, respectively. In general, the shape of the cells was similar to d 1.
Figure 1: Evaluation of cell morphology on d 1 using inverted microscopy following treatment with different concentrations of PPT in growth media. A. Control group (original magnification X200); B. 0.001% group (original magnification X200); C. 0.01% group (original magnification X200); D. 0.1% group (original magnification X200); E. 1% group (original magnification X200); the bar indicates 200 μm.
Figure 2: Evaluation of cell morphology on d 3 in growth media. A. Control group (original magnification X200); B. 0.001% group (original magnification X200); C. 0.01% group (original magnification X200); D. 0.1% group (original magnification X200); E. 1% group (original magnification X200); The bar indicates 200 μm.
Figure 3: Evaluation of cell morphology on d 5. A. Control group (original magnification X200); B. 0.001% group (original magnification X200); C. 0.01% group (original magnification X200); D. 0.1% group (original magnification X200); E. 1% group (original magnification X200); The bar indicates 200 μm.
Figure 4: Evaluation of cell morphology on d 7. A. Control group (original magnification X200); B. 0.001% group (original magnification X200); C. 0.01% group (original magnification X200); D. 0.1% group (original magnification X200); E. 1% group (original magnification X200); The bar indicates 200 μm.
Cellular viability
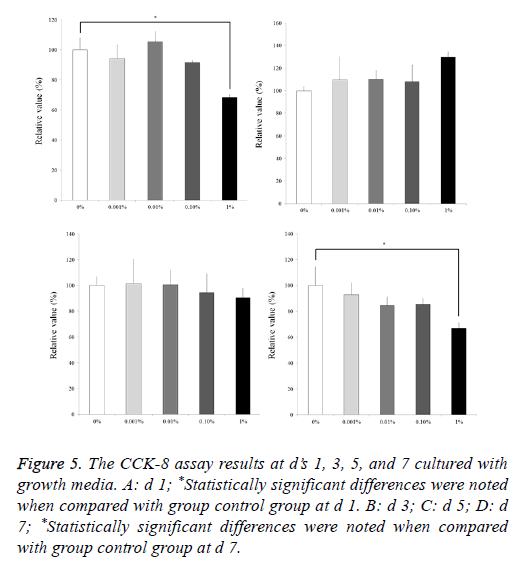
Results from the CCK 8 assay revealed cellular viability on d’s 1, 3, 5, and 7 and are shown in Figure 5. The relative values of CCK-8 at d 1 for 0.001%, 0.01%, 0.1%, and 1% are 94.1 ± 9.0%, 105.5 ± 6.9%, 91.7 ± 1.5%, and 68.5 ± 1.8%, respectively, when the control (0%) group at d 1 is considered 100% (100.0 ± 8.3%). Statistically significant differences were noted with 1% group when compared with group control group at d 1 (P<0.05). The relative values of CCK-8 at d 3 for 0.001%, 0.01%, 0.1%, and 1% are 109.6 ± 20.5%, 110.3 ± 8.1%, 107.9 ± 15.0%, and 129.7 ± 4.8%, respectively, when the control (0%) group at d 1 is considered 100% (100.0 ± 3.7 %). The relative values of CCK-8 at d 5 for 0.001%, 0.01%, 0.1%, and 1% are 101.3 ± 18.8%, 100.6 ± 11.6%, 94.5 ± 14.2%, and 90.5 ± 7.4%, respectively, when the control (0%) group at d 1 is considered 100% (100.0 ± 6.7 %). The relative values of CCK-8 at d 7 for 0.001%, 0.01%, 0.1%, and 1% are 92.9 ± 9.2%, 84.4 ± 7.0%, 85.4 ± 4.6%, and 67.0 ± 4.2%, respectively, when the control (0%) group at d 1 is considered 100% (100.0 ± 14.4 %). Statistically significant differences were noted with 1% group when compared with group control group at d 7 (P<0.05).
Figure 5: The CCK-8 assay results at d’s 1, 3, 5, and 7 cultured with growth media. A: d 1; *Statistically significant differences were noted when compared with group control group at d 1. B: d 3; C: d 5; D: d 7; *Statistically significant differences were noted when compared with group control group at d 7.
Immunofluorescence
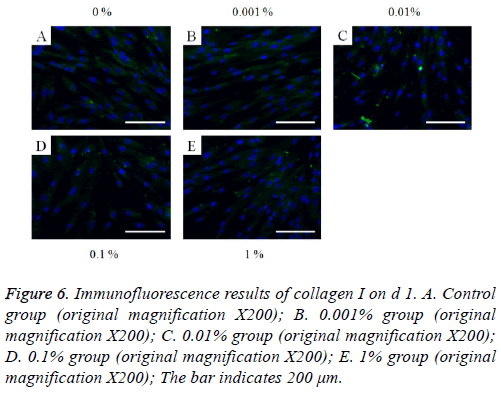
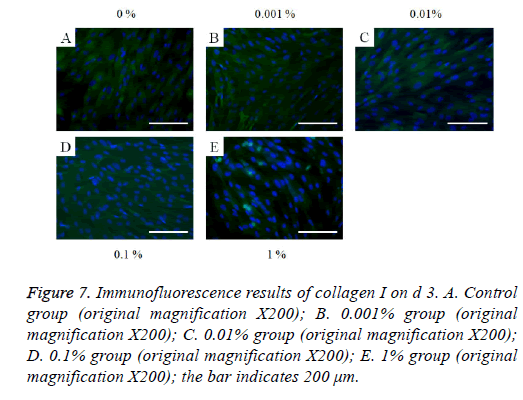
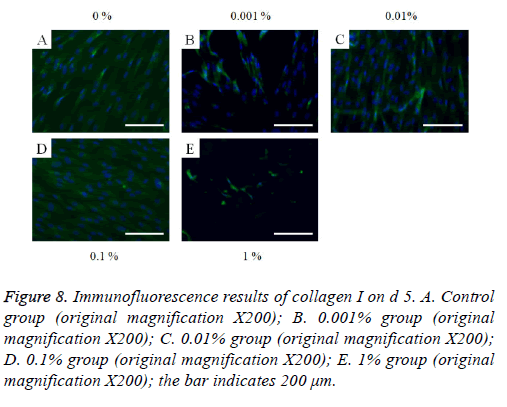
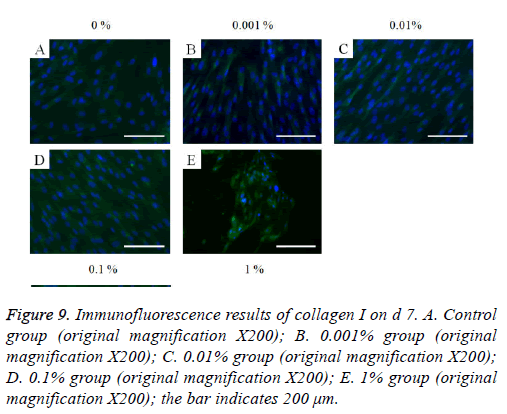
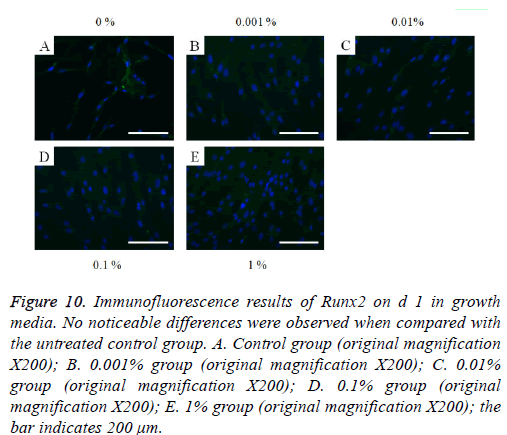
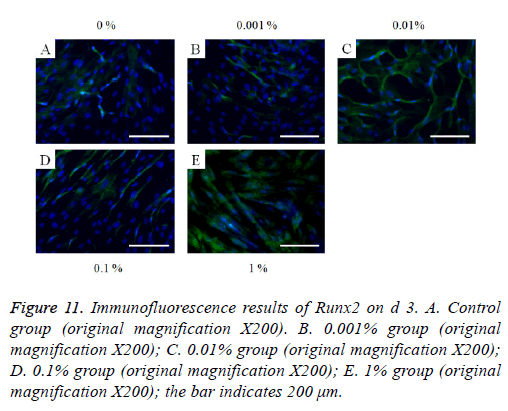
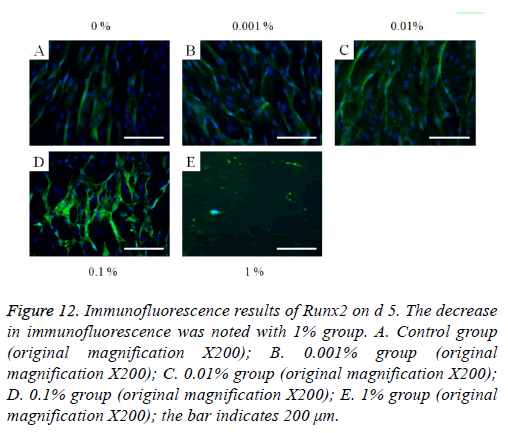
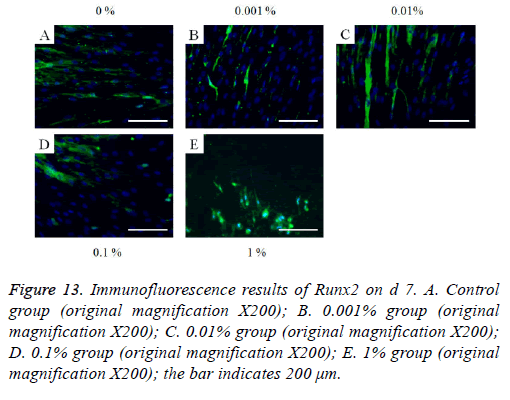
The immunofluorescent assays for collagen I for d’s 1, 3, 5, and 7 are shown in Figures 6-9. Noticeable increase of collagen I expression was noted with the application of PPT, especially at 0.1% (Figure 6). Similar trends were seen in the presence of PPT at d’s 3, 5, and 7 (Figures 7-9). The immunofluorescent assays for Runx2 for d’s 1, 3, 5, and 7 are shown in Figures 10-13. No noticeable differences were observed when compared with the untreated control group at d 1 (Figure 10). However, the decrease in immunofluorescence was noted with 1% group at d 5 (Figure 12).
Figure 6: Immunofluorescence results of collagen I on d 1. A. Control group (original magnification X200); B. 0.001% group (original magnification X200); C. 0.01% group (original magnification X200); D. 0.1% group (original magnification X200); E. 1% group (original magnification X200); The bar indicates 200 μm.
Figure 7: Immunofluorescence results of collagen I on d 3. A. Control group (original magnification X200); B. 0.001% group (original magnification X200); C. 0.01% group (original magnification X200); D. 0.1% group (original magnification X200); E. 1% group (original magnification X200); the bar indicates 200 μm.
Figure 9: Immunofluorescence results of collagen I on d 7. A. Control group (original magnification X200); B. 0.001% group (original magnification X200); C. 0.01% group (original magnification X200); D. 0.1% group (original magnification X200); E. 1% group (original magnification X200); the bar indicates 200 μm.
Figure 10: Immunofluorescence results of Runx2 on d 1 in growth media. No noticeable differences were observed when compared with the untreated control group. A. Control group (original magnification X200); B. 0.001% group (original magnification X200); C. 0.01% group (original magnification X200); D. 0.1% group (original magnification X200); E. 1% group (original magnification X200); the bar indicates 200 μm.
Figure 11: Immunofluorescence results of Runx2 on d 3. A. Control group (original magnification X200). B. 0.001% group (original magnification X200); C. 0.01% group (original magnification X200); D. 0.1% group (original magnification X200); E. 1% group (original magnification X200); the bar indicates 200 μm.
Figure 12: Immunofluorescence results of Runx2 on d 5. The decrease in immunofluorescence was noted with 1% group. A. Control group (original magnification X200); B. 0.001% group (original magnification X200); C. 0.01% group (original magnification X200); D. 0.1% group (original magnification X200); E. 1% group (original magnification X200); the bar indicates 200 μm.
Figure 13: Immunofluorescence results of Runx2 on d 7. A. Control group (original magnification X200); B. 0.001% group (original magnification X200); C. 0.01% group (original magnification X200); D. 0.1% group (original magnification X200); E. 1% group (original magnification X200); the bar indicates 200 μm.
Discussion
This report discusses the effects of different concentrations of PPT on the morphology and cellular viability of human gingival stem cells. This study clearly showed that short term application of Pongamia pinnata enhanced the proliferation of mesenchymal stem cells.
Previous research showed that decreased proliferation and differentiation potential is noted with increased aging and presence of systemic diseases [18]. Due to the limited number of available cells, stem cells can be expanded before being applied [12]. The herbal extracts have been tested for the enhancement of stem cells [11-14,19]. The application of low dose of PPT enhanced cell proliferation by 5 to 10%. In this aspect, PPT can be applied to overcome the low survival or improve the survival of transplanted stem cells.
Various methods can be used for the extraction of herbs [3,20-23]. The dried herb can be boiled in distilled water for a few hours for extraction under reflux [3]. The herb can be extracted using organic solvents such as ethanol and methanol [21]. In one study, the dried herb was first extracted with 70% ethanol and subsequently fractionated into five parts: n-hexane, methylene chloride, ethyl acetate, n-butanol, and water fractions [20]. In this study, methanol was use for the extraction; methanol has a lower boiling point when compared with ethanol.
In this study, the protein expression of collagen I is used to reveal the mechanism of PPT. Collagen I is one of the most abundant structural proteins [24]. Collagen I is reported to be associated with cell attachment and cell proliferation [25]. This study showed a noticeable increase in collagen I expression with the application of PPT, especially at 0.1% concentration. This assumes that the enhanced cell proliferation was associated with higher expression of collagen I. A CCK-8 assay was used for the evaluation of cell proliferation [26]. This is one of most stable with minimal damage to the tested cells assays because it determines mitochondrial activity and does not need a solubilization process. Herbal products are gaining interest as an alternative to chemicals for use in cell therapy [6,27,28]. Due to advances in technology, the field of herbal medicine will continue to develop to provide unmet needs [29].
Conclusion
Based on these findings, it was concluded that PPT could produce beneficial effects on mesenchymal stem cells with enhanced collagen I expression.
Acknowledgement
This research was partly supported by Catholic Institute of Cell Therapy (CIC, Seoul, Korea), partly supported by Basic Science Research Program through the National Research Foundation of Korea (NRF) funded by the Ministry of Science, Information and Communication Technology and Future Planning (NRF-2017R1A1A1A05001307), and partly funded by the Ministry of Science, ICT and Future Planning, Republic of Korea government (NRF-2016K1A1A8A01939075). The authors report no conflict of interest related to this study.
Conflict of Interests
The authors report no conflicts of interest related to this study. The author does not have any financial interest in the companies whose materials are included in the article.
References
- Lee KH. Research and future trends in the pharmaceutical development of medicinal herbs from Chinese medicine. Public Health Nutr 2000; 3: 515-522.
- Feng Y, Wu Z, Zhou X, Zhou Z, Fan W. Knowledge discovery in traditional Chinese medicine: state of the art and perspectives. Artif Intell Med 2006; 38: 219-236.
- Jeong SH, Lee JE, Jin SH, Ko Y, Park JB. Effects of Asiasari radix on the morphology and viability of mesenchymal stem cells derived from the gingiva. Mol Med Rep 2014; 10: 3315-3319.
- Oh SM, Kim J, Lee J, Yi JM, Oh DS, Bang OS. Anticancer potential of an ethanol extract of Asiasari radix against HCT-116 human colon cancer cells in vitro. Oncol Lett 2013; 5: 305-310.
- Satish PVV, Sunita K. Antimalarial efficacy of Pongamia pinnata (L) Pierre against Plasmodium falciparum (3D7 strain) and Plasmodium berghei (ANKA). BMC Complement Altern Med 2017; 17: 458.
- Li J, Jiang Z, Li X, Hou Y, Liu F, Li N. Natural therapeutic agents for neurodegenerative diseases from a traditional herbal medicine Pongamia pinnata (L.) Pierre. Bioorg Med Chem Lett 2015; 25: 53-58.
- Al Muqarrabun LM, Ahmat N, Ruzaina SA, Ismail NH, Sahidin I. Medicinal uses, phytochemistry and pharmacology of Pongamia pinnata (L.) Pierre: a review. J Ethnopharmacol 2013; 150: 395-420.
- Brijesh S, Daswani PG, Tetali P, Rojatkar SR, Antia NH, Birdi TJ. Studies on Pongamia pinnata (L.) Pierre leaves: understanding the mechanism(s) of action in infectious diarrhea. J Zhejiang Univ Sci B 2006; 7: 665-674.
- Badole SL, Bodhankar SL. Antidiabetic activity of cycloart-23-ene-3beta, 25-diol (B2) isolated from Pongamia pinnata (L. Pierre) in streptozotocin-nicotinamide induced diabetic mice. Eur J Pharmacol 2010; 632: 103-109.
- Badole SL, Zanwar AA, Khopade AN, Bodhankar SL. In vitro antioxidant and antimicrobial activity cycloart-23-ene-3beta,-25-diol (B2) isolated from Pongamia pinnata (L. Pierre). Asian Pac J Trop Med 2011; 4: 910-916.
- Yang P, Guan YQ, Li YL, Zhang L, Zhang L, Li L. Icariin promotes cell proliferation and regulates gene expression in human neural stem cells in vitro. Mol Med Rep 2016; 14: 1316-1322.
- Qin S, Zhou W, Liu S, Chen P, Wu H. Icariin stimulates the proliferation of rat bone mesenchymal stem cells via ERK and p38 MAPK signaling. Int J Clinic Exp Med 2015; 8: 7125-7133.
- Yao R, Zhang L, Li X, Li L. Effects of Epimedium flavonoids on proliferation and differentiation of neural stem cells in vitro. Neurol Res 2010; 32: 736-742.
- Hucklenbroich J, Klein R, Neumaier B, Graf R, Fink GR, Schroeter M. Aromatic-turmerone induces neural stem cell proliferation in vitro and in vivo. Stem Cell Res Ther 2014; 5: 100.
- Sholehvar F, Mehrabani D, Yaghmaei P, Vahdati A. The effect of Aloe vera gel on viability of dental pulp stem cells. Dent Traumatol Off Publ Int Assoc Dent Traumatol 2016; 32: 390-396.
- Jin SH, Lee JE, Yun JH, Kim I, Ko Y, Park JB. Isolation and characterization of human mesenchymal stem cells from gingival connective tissue. J Periodont Res 2015; 50: 461-467.
- Lee SI, Ko Y, Park JB. Evaluation of the maintenance of stemness, viability, and differentiation potential of gingiva-derived stem-cell spheroids. Exp Ther Med 2017; 13: 1757-1764.
- Varghese J, Griffin M, Mosahebi A, Butler P. Systematic review of patient factors affecting adipose stem cell viability and function: implications for regenerative therapy. Stem Cell Rese Ther 2017; 8: 45.
- Zhang N, Kang T, Xia Y, Wen Q, Zhang X, Li H. Effects of salvianolic acid B on survival, self-renewal and neuronal differentiation of bone marrow derived neural stem cells. Eur J Pharmacol 2012; 697: 32-39.
- Kim SY, An SY, Lee JS, Heo JS. Zanthoxylum schinifolium enhances the osteogenic potential of periodontal ligament stem cells. In Vitro Cell Develop Biol Animal 2015; 51: 165-173.
- Wang MH, Jeong SH, Guo H, Park JB. Anti-inflammatory and cytotoxic effects of methanol, ethanol, and water extracts of Angelicae dahuricae Radix. J Oral Sci 2016; 58: 125-131.
- Jeong SH, Kim BB, Lee JE, Ko Y, Park JB. Evaluation of the effects of Angelicae dahuricae radix on the morphology and viability of mesenchymal stem cells. Mol Med Rep 2015; 12: 1556-1560.
- Jeong SH, Lee JE, Kim BB, Ko Y, Park JB. Evaluation of the effects of Cimicifugae Rhizoma on the morphology and viability of mesenchymal stem cells. Exp Ther Med 2015; 10: 629-634.
- Wong Po Foo C, Kaplan DL. Genetic engineering of fibrous proteins: spider dragline silk and collagen. Adv Drug Deliv Rev 2002; 54: 1131-1143.
- Ruggiero F, Exposito JY, Bournat P, Gruber V, Perret S, Comte J. Triple helix assembly and processing of human collagen produced in transgenic tobacco plants. FEBS Lett 2000; 469: 132-136.
- Ha DH, Pathak S, Yong CS, Kim JO, Jeong JH, Park JB. Potential differentiation ability of gingiva originated human mesenchymal stem cell in the presence of tacrolimus. Sci Rep 2016; 6: 34910.
- Li J, Wei Y, Li X, Zhu D, Nie B, Zhou J. Herbal formula Xian-Fang-Huo-Ming-Yin regulates differentiation of lymphocytes and production of pro-inflammatory cytokines in collagen-induced arthritis mice. BMC Complement Altern Med 2017; 17: 12.
- Bodinet C, Freudenstein J. Influence of marketed herbal menopause preparations on MCF-7 cell proliferation. Menopause 2004; 11: 281-289.
- Brown DG, Lister T, May-Dracka TL. New natural products as new leads for antibacterial drug discovery. Bioorg Med Chem Lett 2014; 24: 413-418.
