ISSN: 0970-938X (Print) | 0976-1683 (Electronic)
Biomedical Research
An International Journal of Medical Sciences
Research Article - Biomedical Research (2017) Volume 28, Issue 10
SOCS3 is involved in cardiomyocyte hypertrophy induced by Ang II
Jian-min Yang1,2, Bin Chen2, Hong Li2, Guo-xin Tong2 and Shu-zheng Lv1*
1Department of Cardiology, Beijing Anzhen Hospital, Capital Medical University, Beijing, PR China
2Department of Cardiology, Hangzhou First People`s Hospital, Hangzhou, PR China
- *Corresponding Author:
- Shu-zheng Lv
Department of Cardiology, Beijing Anzhen Hospital
Capital Medical University, PR China
Accepted date: February 27, 2017
Keywords
Suppressors of cytokine signalling 3, Cardiomyocyte hypertrophy, Angiotensin-2
Introduction
Cardiac hypertrophy is a response of myocardium to the stimulation of mechanical load and neurohumor factors [1], which is caused by hypertension, coronary heart disease, myocardial infarction and congenital heart disease etc. [2,3]. Cardiac hypertrophy often leads to congestive heart failure and severe arrhythmia and is a regarded as a common complication of cardiovascular disorders [4].
Renin-Angiotensin System (RAS) is one of the most important reasons causing cardiac hypertrophy [5]. As a major and key player of RAS system, Ang II facilitate the growth and proliferation of a variety of cardiovascular cells such as the cardiomyocytes, cardiac fibroblasts and vascular smooth muscle cells, leading to the increase in total protein content of cardiomyocytes and in protein synthesis rate, which results in cardiac hypertrophy [6]. In recent years, the role of Ang II in the mechanism of cardiac hypertrophy has been investigated intensively.
Suppressors of Cytokine Signalling (SOCS) are a family of cytoplasmic proteins [7]. SOCS-1 and -3 are two important members of SOCS family which negatively regulate the intracellular cytokine signaling pathway, including Janus kinase (JAK)/Signal Transducers and Activators of Transcription (STAT), Ras/MAPK and ERK, and PI3K/Akt [8].
The role of SOCS-1 and -3 in cellular hypertrophic response, particularly in cardiomyocytes, has not been well elucidated. Previous studies show that SOCS-1 gene transfer accelerates the transition to heart failure through the inhibition of the gp130/JAK/STAT pathway [9]. Another study shows that absence of SOCS-3 in the cardiomyocyte increases mortality in a gp130 dependent manner accompanied by contractile dysfunction and ventricular arrhythmias [10]. SOCS-3 is a mechanical stress-inducible gene in cardiac muscle cells and that it directly modulates stress-induced gp130 cytokine receptor signaling as the key molecular switch for a negative feedback circuit for both myocyte hypertrophy and survival [11]. In this study we cultured rat cardiomyocytes explore the effects of two SOCS members on the regulation of cardiomyocyte hypertrophic response induced by Ang II.
Materials and Methods
Rat neonatal cardiomyocytes culture and treatment
The whole hearts from neonate rats were isolated, minced and rinsed in hood by using the method invented and patented by Dr. Xuwei Hou (patent number: CN 101955884 A and CN 101955884 B). Briefly, the whole hearts from neonate Wistar rats (age less than 3 days) were isolated, minced and rinsed in hood. Five to six cycles of digestion using collagenase (95 U/ml) (Sigma Aldrich, Bornem, Belgium) and 0.6 U/ml of pancreatin (Sigma Aldrich, Bornem, Belgium) were performed. At the end of each cycle, the suspension was centrifuged and the supernatant collected, pooled, centrifuged and resuspended in the cardiac medium containing DMEM and M199 (volume ratio: 4:1) [12].
Quantitative RT-PCR
Total RNA was prepared using TRIzol reagent (Invitrogen) according to the manufacturer’s instructions. cDNA was synthesized with 1 μg of total RNA by reverse transcriptase. qRT-PCR analysis was performed with LightCycler (Roche Diagnostics) to determine the mRNA levels of SOCS1 and SOCS3. The following primers were used in qRT-PCR: SOCS1 (forward, 5’-GCCATCTTCACGCTGAGC-3’; reverse, 5’- GCCATCTTCACGCTAAGGGC-3’); SOCS3 (forward, GCCACCTACTGAACCCTCCTC, reverse TCCGACAGAGATGCTGAAGAGTG) and β-actin was used as an internal control with primers as follows (forward, 5’- CAGCCTTCCTTCTTGGGTAT-3’; reverse, 5’- CTGTGTTGGCATAGAGGTCTT-3’).
SOCS1 and SOCS3 inhibition by si-RNA transfection
Cells were plated at 4 × 10⁵ cells per well on 6 well plates the day before the transfection. The SOCS3 siRNA and SOCS1 siRNA and scramble sequences was transfected using GenMute siRNA and DNA Transfection Reagent (SignaGen, USA) using 10 nM si-RNA together with 2 uL GenMute™ reagent according to the manufacturer’s protocol. The sequences of MsiRNAs are as following: SOCS-1 siRNA (sense sequence, GCAUCCGCGUGCACUUUCAUU) and SOCS3 (5’- GCGTAATACGACTCACTATAGGGAGACTCAAGACCTT CAGCTCCAA-3’ and antisense 5’- GCGTAATACGACTCACTATAGGGAGATTCTCATAGGAG TCCAGGTG-3’). The culture medium was changed after 8 h and the cardiomyocytes were incubated for 48 h to perform functional experiments or lysed in Trizol Reagent® (Invitrogen, Carlsbad, CA, USA) for western blot analyses.
Morphometric analysis
After si-RNA transfection, the cells were then treated with Ang II (5-500 nM) for 48 hours to induce cellular hypertrophy [13,14].
To examine changes in cell morphology and cytoskeleton, cells were fixed in 4%paraformaldehyde, stained with FITCconjugated Phalloidin (Sigma) for 30 min and mounted in Vectashield with 4’, 6-diamidino-2-phenylindole (Vector Laboratories, Peterborough, UK). Cellular hypertrophy was evaluated by measuring cardiomyocytes surfaces using a digital image analysis system (Leica QwinV3, Leica Microsystems Ltd., Cambridge, UK). Five random fields (with approximately 10 to 15 cells per field) from every sample were averaged and expressed as μm2/cell. All experiments were repeated three times.
Measurement of protein contain per cell
The cultured cardiomyocytes (5 × 10⁶ cells) were trypsinized and counted using a cell counting chamber (Beckman Coulter, Fullerton, CA, USA) and then lysed with RIPA buffer (Santa Cruz Biotechnology, Santa Cruz, USA). The protein concentration was measured using BCA protein assay kit (BioVision, Inc., Milpitas, CA). Then the protein synthesis of cells was determined by dividing the total amount of protein by the number of cells, namely, protein per cell [15].
Western Blotting analysis for cardiomyocyte hypertrophy related proteins
The isolated protein (25 μg) from cardiomyocytes was separated by 10% SDS-PAGE and transferred onto polyvinylidene difluoride nylon membranes. The blots were probed with anti-rat Apelin peptide (1: 1000 dilution, Santa Cruz Biotechnology, Santa Cruz, USA), anti-rat atrial natriuretic peptide (ANP), Osteopontin (OPN) and transforming growth factor beta (TGF-β1) (all 1: 1000 dilution, Millipore, USA), anti-GAPDH antibody (1: 1000 dilution; Santa Cruz Biotechnology, Santa Cruz, USA). Then with horseradish peroxidase-conjugated secondary antibodies (1: 5000 dilution), and visualized using an ECL detection kit (Amersham Biosciences, Piscataway, NJ, USA). The optical densities of the bands were quantified by densitometric analysis performed with a quantitative imaging system (Bio- Rad, USA). All western blot experiments were repeated three times.
Statistical analyses
Each experiment was performed at least three times and the data are presented as mean ± SEM for the indicated number of separate experiments. Student’s t-test or one-way ANOVA analysis was used to compare the mean of each group with that of the control group in experiments. All analysis was performed by SPSS 17.0 System. Results were considered to be significant if the P-value was less than 0.05.
Results
Ang II increases the cellular size and protein content per cell
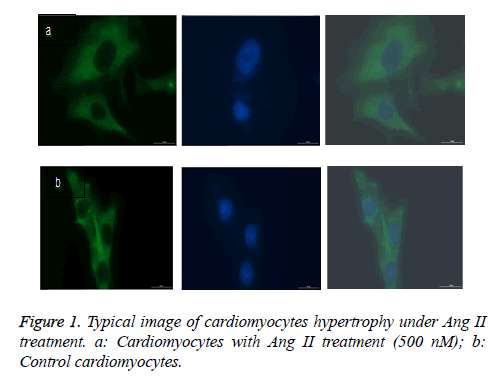
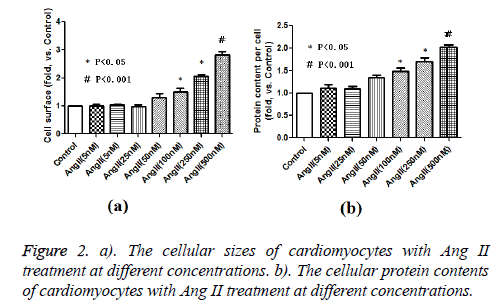
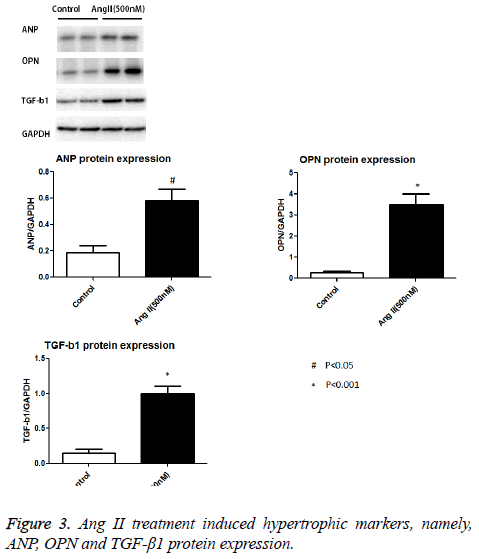
As expected, AngII stimulation dramatically increased the cellular size and protein content per cell in a dose dependent manner. AngII started to stimulate cardiomyocyte hypertrophy at 100 nM, and reached the maximum pro-hypertrophic effect at the concentration of 500 nM (Figure 1 and Figures 2a and 2b). We detected the hypertrophic markers, e.g. ANP, OPN and TGF-β1 using western blot assay. Our data show that Ang II treatment induced increased ANP, OPN and TGF-β1 protein expression levels in cultured cardiomyocytes as opposed to control cells (Figure 3).
The SOCS1 and 3 expressions in cultured cardiomyocytes after Ang II treatment
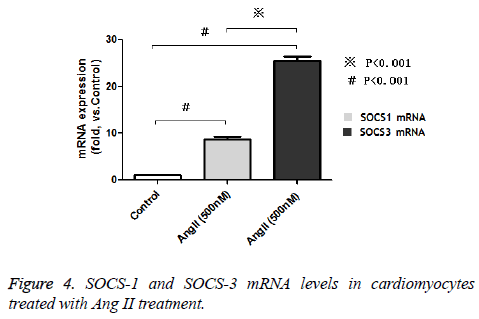
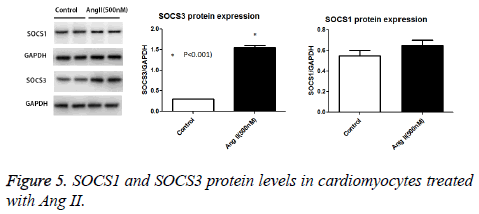
We performed Western blot and real time PCR to detect the SOCS-1 and 3 mRNA and protein expressions in cultured cardipmyocytes after Ang II treatment. Our data show that Ang II dramatically increased the SOCS1 and 3 mRNA expression levels compared to untreated control cells in a dose dependent manner. SOCS-1 mRNA expression level increased about 8 times while SOCS-3 mRNA increased 25 times (Figures 4). As for the protein expression, we found that the SOCS-3 protein levels were augmented by Ang II treatment while the SOCS-1 remains unchanged after treatment (Figure 5).
SOCS1 and SOCS3 inhibition by si-RNA technique abolished the hypertrophic response to Ang II
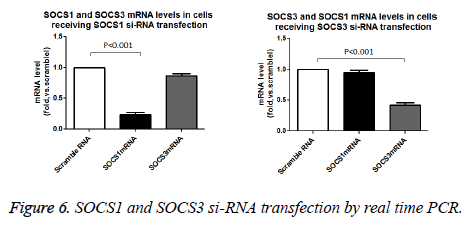
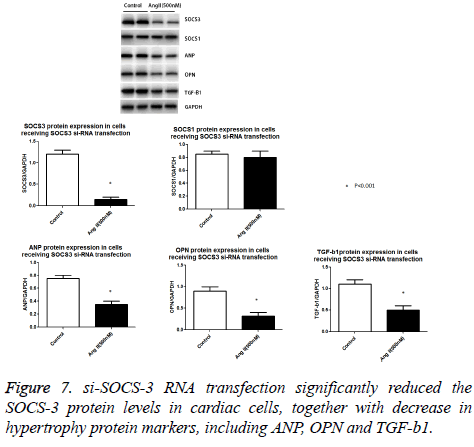
We used the si-RNA to knock down the SOCS-1 and SOCS-3 expression in cardiac cells. As shown in Figure 6, both SOCS-1 and SOCS-3 si-RNA transfection specifically caused marked reduction in SOCS-1 and SOCS-3 protein expressions (Figure 7).
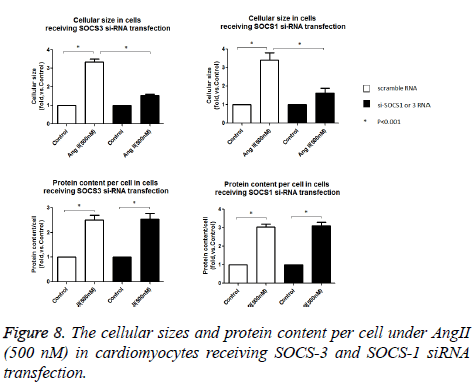
With the Ang II treatment, the cells receiving siRNA SOCS-1 still show a significant increase in cellular size and protein content (Figure 8). In contrast, the cells receiving SOCS-3 si- RNA transfection, cells show a dramatically reduction in cell surface, protein content (Figure 8) and ANP, OPN and TGF-β1 protein expression were down-regulated (Figure 7). These data suggest that Ang II induced hypertrophic response in cultured cardipmyocyte is abolished by the know-down of SOCS-3, implying the povital role of SOCS-3 in Ang II induced cardiac hypertrophy.
Discussion
In this study, we found that inhibition of SOCS-3 totally abolished the Ang II induced cardiomyocyte hypertrophic response. The inhibition of another SOCS family member, SOCS-1, however, did not change the cellular hypertrophy after Ang II treatment. For the first time, our data provide clear evidence that SOCS-3 is essential in the cardiac hypertrophy induced by Ang II.
Calegari et al. reported that SOCS3 is constitutively expressed at a low level in rat heart and neonatal rat ventricular myocytes and Ang II at a physiological concentration enhances the expression of SOCS3 mRNA and protein, mainly via AT1 receptors [16]. Consistent with their findings, we also observed that Ang II increased SOCS3 protein expression in cultured VSMCs. In Calegari’s study, pre-treatment of rats with a specific phosphorthioate antisense oligonucleotide to SOCS-3 can reverse the desensitization to angiotensin signaling, as detected by a fall in c-Jun expression after repetitive infusions of the hormone. In our study, we observed that Ang II increase the cellular surface, per cell protein content, accompanied by increased expression of three hypertrophy related proteins, including ANP, OPN and TGF-β1 protein in cells. Also, we found that the Ang II induced SOCS-1 and SOCS-3 at both mRNA and protein levels. It remains unclear if Ang II affects the expression of other SOCS family members.
More importantly, we find that SOCS-3 inhibition by si-RNA technique dramatically restored the cellular surface, per cell protein content back to basal level and reduced expression of three hypertrophy induced by Ang II. In contrast, SOCS-1 did not reverse the Ang II induced hypertrophy in cardioyocytes. The mechanism underlying this phenomenon remains unclear. Previous studies reveal that SOCS-3 is constituted by cytokineinducible proteins that modulate receptor signal transduction via tyrosine kinases, mainly the JAK-STAT pathway [17]. Given the importance of JAK/STAT pathway in regulating the cardiac cell hypertrophy, we hypothesis that the inhibition of SOCS-3 may interfere with the JAK-STAT pathway, thus alleviate the pro-hypertrophyic response of Ang II. Study focusing on the signal transduction pathway of SOCS3 and JAK/STAT under Ang II stimulus is still on-going now.
Conclusion
The inhibition of SOCS3 totally abolished the Ang II induced cardiomyocyte hypertrophic response. The inhibition of another SOCS family member, SOCS1, however, did not change the cellular hypertrophy after Ang II treatment.
Limitation
Several limitations should be addressed in this study. Firstly, we reported only the preliminary finding and there is no detailed molecular mechanism involved. Secondly, we did not understand why only SOCS-3, rather than SOCS-1, alleviated the hypertrophic response by Ang II. Thirdly, the other SOCS-3 family members are not tested in this study.
Authors’ Contributions
All authors listed in this manuscript participated in the design and coordination of the study and made substantial contribution to the intellectual content of the project to be included as authors. All authors read and approved the manuscript.
Competing Interests
The authors declare that they have no competing interests.
References
- Heinzel FR, Hohendanner F, Jin G, Sedej S, Edelmann F. Myocardial hypertrophy and its role in heart failure with preserved ejection fraction. J Appl Physiol (1985) 2015; 119: 1233-1242.
- Cooper G. Basic determinants of myocardial hypertrophy: a review of molecular mechanisms. Annu Rev Med 1997; 48: 13-23.
- Anversa P, Capasso JM, Ricci R. Morphometric analysis of coronary capillaries during physiologic myocardial growth and induced cardiac hypertrophy: a review. Int J Microcirc Clin Exp 1989; 8: 353-363.
- Toyama S, Ishiyama T, Terada A, Yamagami T, Okamoto K. The prognosis of cardiac hypertrophy. Bull World Health Organ 1963; 28: 269-272.
- Piratello AC, Moraes-Silva I, Paulini J. Renin angiotensin system and cardiac hypertrophy after sinoaortic denervation in rats. Clinics (Sao Paulo) 2010; 65: 1345-1350.
- Le Corvoisier P, Adamy C, Sambin L. The cardiac renin-angiotensin system is responsible for high-salt diet-induced left ventricular hypertrophy in mice. Eur J Heart Fail 2010; 12: 1171-1178.
- Sasi W, Sharma AK, Mokbel K. The role of suppressors of cytokine signalling in human neoplasms. Mol Biol Int 2014; 2014: 630797.
- Culig Z. Suppressors of cytokine signalling-3 and -1 in human carcinogenesis. Front Biosci (Schol Ed) 2013; 5: 277-283.
- Cittadini A, Monti MG, Laccarino G. SOCS1 gene transfer accelerates the transition to heart failure through the inhibition of the gp130/JAK/STAT pathway. Cardiovasc Res 2012; 96: 381-390.
- Yajima T, Murofushi Y, Zhou H. Absence of SOCS3 in the cardiomyocyte increases mortality in a gp130-dependent manner accompanied by contractile dysfunction and ventricular arrhythmias. Circulation 2011; 124: 2690-2701.
- Yasukawa H, Hoshijima M, Gu Y. Suppressor of cytokine signaling-3 is a biomechanical stress-inducible gene that suppresses gp130-mediated cardiac myocyte hypertrophy and survival pathways. J Clin Invest 2001; 108: 1459-1467.
- Hou X, Hu Z, Xu H, Xu J, Zhang S. Advanced glycation endproducts trigger autophagy in cadiomyocyte via RAGE/PI3K/AKT/mTOR pathway. Cardiovasc Diabetol 2014; 13: 78.
- Maggie KDS, Erik JH. Direct inhibition by angiotensin II of insulin-dependent glucose transport activity in mammalian skeletal muscle involves a ROS-dependent mechanism. Arch Physiol Biochem 2010; 116: 88-95.
- Prasannarong M, Santos FR, Henriksen EJ. ANG (1–7) reduces ANG II-induced insulin resistance by increasing Akt phosphorylation via a Mas receptor-dependent mechanism in rat skeletal muscle. Biochem Biophys Res Commun 2012; 426: 369-373.
- Su FF, Shi MQ, Guo WG. High-mobility group box 1 induces calcineurin-mediated cell hypertrophy in neonatal rat ventricular myocytes. Mediators Inflamm 2012; 2012: 805149.
- Calegari VC, Bezerra RM, Torsoni MA. Suppressor of cytokine signaling 3 is induced by angiotensin II in heart and isolated cardiomyocytes, and participates in desensitization. Endocrinology 2003; 144: 4586-4596.
- Hernandez-Vargas P, Lopez-Franco O, Sanjuan G. Suppressors of cytokine signaling regulate angiotensin II-activated Janus kinase-signal transducers and activators of transcription pathway in renal cells. J Am Soc Nephrol 2005; 16: 1673-1683.
