ISSN: 0970-938X (Print) | 0976-1683 (Electronic)
Biomedical Research
An International Journal of Medical Sciences
Research Article - Biomedical Research (2018) Volume 29, Issue 18
Status of vitamin-D in relation to glycemic indices and lipid profile in postmenopausal women with type 2 diabetes mellitus: a case controlled study in Riyadh, KSA
Manal Abudawood1, Feda Aljaser1, Hajera Tabassum1, Sabah Ansar1, Sarah Alsobaie1, Basmah Almaarik1, Khalid Almosa2, Samia Sobki3, Mir Naiman Ali4 and Ali Aljohi3*
1Department of Clinical Laboratory Sciences, King Saud University, Riyadh, Saudi Arabia
2Center for Health Studies, Prince Sultan Military Medical City, Riyadh, Saudi Arabia
3Central Military Laboratory and Blood Bank, Prince Sultan Military Medical City, Riyadh, Saudi Arabia
4Division of Microbiology, Riyadh Municipality Central Area labs for Environmental Health, Riyadh, Saudi Arabia
- *Corresponding Author:
- Ali Aljohi
Central Military Laboratory and Blood Bank
Prince Sultan Military Medical City
Saudi Arabia
Accepted date: September 25, 2018
DOI: 10.4066/biomedicalresearch.29-18-990
Visit for more related articles at Biomedical ResearchAbnormal vitamin D level and glucose homeostasis are two most chronic medical conditions leading to cardiovascular disease following menopause transition in females. Low levels of vitamin D could be associated with elevated risk of type 2 diabetes mellitus (T2DM). The aim of the present study was to evaluate and compare vitamin D status in relation to glycemic indices, metabolic parameters between pre and postmenopausal women with T2DM. Levels of fasting blood glucose, HbA1C, lipid profile and vitamin D were measured in pre and postmenopausal T2DM women and analysed by SPSS software. Levels of HbA1C, FBG, TC, Tg, LDL-C and obesity parameters like BMI and visceral fat increased significantly (p<0.001) whereas serum levels of HDL-C and vitamin D decreased significantly in postmenopausal T2DM women compared to premenopausal group. Vitamin D was negatively correlated with age, HbA1C, LDL-C at p<0.05. Decreased levels of vitamin D exhibited strong negative correlation with metabolic or obesity factors like BMI and waist circumference. The present investigation unravels the relationship between vitamin D and cholesterol and it was found that HDL-C although decreased with menopause, there was no significant association between HDL-C and decreased vitamin D in postmenopausal T2DM females. Results from this study suggests that hypovitaminosis D accompanied with dyslipidimia, increased BMI and obesity increases the risk factors for cardiovascular diseases in postmenopausal women with T2DM.
Keywords
Lipid profile, Vitamin D, Obesity, Diabetes mellitus, Premenopause, Postmenopause
Introduction
Type 2 diabetes mellitus (T2DM), a metabolic disease characterized with hyperglycemia results due to insulin deficiency [1]. It is a multifactorial disease caused by genetic and environmental factors. T2DM can lead to a number of chronic microvascular and macrovascular conditions such as retinopathy, nephropathy and cardiovascular disease (CVD) when it is undiagnosed and left untreated. Risk factors like poor nutrition, physical inactivity and obesity contributes to development of T2DM. Currently, vitamin D has sparked widespread interest in the pathogenesis of diabetes [2]. The overall prevalence of DM in Kingdom of Saudi Arabia, was estimated to be 23.7% and diabetes was reported as 8.3% in the age group (20 to 70 years) in 2013 and has been predicted to reach 10.1% by 2035 [3]. Hypovitaminosis D has been identified as a risk factor for many chronic diseases including T2DM [4]. Both T2DM and vitamin D deficiency are common health problems among the Saudi population. There exists a correlation between serum vitamin D concentration and dyslipidemia [5]. CVDs is one of the main reasons of death among women in the world. In addition to T2DM, obesity is also a major risk factor leading to coronary artery diseases.
A group of characteristics like insulin resistance observed in T2DM are also observed in metabolic syndrome. In addition, the post menopause status among aged women may be contributing factor leading to metabolic syndrome and increased prevalence of diabetes from 32.6% to 41.5% [6]. Menopause seems to be associated with increased risk of glucose intolerance and type 2 diabetes [7]. Worldwide vitamin D deficiency is the most common health problem among postmenopausal women. Increased obesity or fat decreased metabolic rate and physical activity may also influence the risk of cardiovascular disease during menopause. A distinct physiological change that occurs during menopause is a shift towards a more atherogenic lipid profile [8]. Abnormalities in lipid profile of patients with diabetes are likely to play an important role in the development of atherosclerosis. The mechanism that explains the effect of menopause on the cardiovascular system still remains unclear. Some studies show that there is no difference in cardiovascular risk factors among pre and postmenopausal women [9]. Keeping in view the scarcity of data available on the extent of vitamin D deficiency in postmenopausal Saudi women with T2DM, the present study was aimed to evaluate vitamin D status in relation to glycemic indices, lipid profile and to correlate vitamin-D status with other risk factors like obesity and metabolic parameters in postmenopausal women.
Material and Methods
Study population
In the present cross sectional study, a total of 4843 volunteers participated, of which 1554 were females with type 2 diabetes. The sample selection was based on stratified random sampling procedure. The total population of 4843 was divided into 2 strata based on gender and 1554 females were enrolled. Among 1554 females only 600 T2DM female participants were selected based on diabetic history of 2-3 years and divided into two groups randomly; 300 premenopausal women and 300 postmenopausal women. The study was carried out in Prince Sultan Military Medical City in collaboration with Department of Clinical laboratory Sciences, College of Applied Medical Sciences, King Saud University, Riyadh, Saudi Arabia. Ethical approval was granted by the ethics Committee of the Prince Sultan Military Medical City hospital.
Inclusion criteria: Adult female patients with vitamin D deficiency suffering with T2DM with duration of 2-3 years. The patients were advised verbally to expose themselves to sunlight for minimum 30 min twice a week, on grounds of sedentary lifestyle and cultural and religious customs followed by females in Saudi Arabia.
Exclusion criteria: Subjects were screened and patients with type 1 diabetes or recently diagnosed diabetes, cardiac problems, chronic and other metabolic disorders were excluded. Females on vitamin D supplementation and other drugs were selected and excluded from the study so that the role of vitamin D alone (without supplementation) and other variables would be elucidated.
Anthropometric studies
Body weight and height were measured with an electronic balance and stadiometer, BMI was calculated as kg/m2. Waist circumference (WC) was defined as the abdominal circumference immediately above the iliac crests. WC was used as an indicator of abdominal fat or visceral fat.
Sample collection and laboratory investigations
After 12 h of fasting, 8 ml of blood sample was collected by venipuncture in a labeled sterile vacutainers, and 1 ml was taken in an EDTA-coated tube for HbA1C analysis. All the biochemical parameters like fasting blood glucose (FBG), HbA1C, estrogen (estradiol), lipid profile parameters, i.e., total cholesterol (TC), triglycerides (Tg), high-density lipoprotein cholesterol (HDL-C), low-density lipoprotein cholesterol (LDL-C) were analysed by fully automatic analyzer, ROCHE module Cobas 8000 (C701 and C702). LDL-C was estimated by Friedewald’s formula [10]. Serum 25 (OH) D3 was measured by using commercially available kits using Roche Elecsys 2010 Modular Analytics E170-Cobas e 411 utilizing electro-chemiluminescence immunoassay (Roche Diagnostics, Germany).
Statistical analysis
Statistical analysis was performed using SPSS software. Comparison between the groups was done by one way ANOVA followed by Holm-Sidak test. A value of P<0.05 was considered to be statistically significant. The correlation between levels of vitamin-D with other variables was performed by Pearson’s correlation (r) and graphs were plotted by multiple logistic regression.
Results
Anthropometric parameters and comparison of the biochemical parameters in pre and postmenopausal T2DM women are presented in Table 1. Mean ± SD values of HbA1C, FBG, TC, Tg and LDL were significantly increased in postmenopausal T2DM women compared to premenopausal women. In contrast to these parameters, serum levels of HDL-C and estrogen decreased significantly in postmenopausal T2DM women compared to premenopausal T2DM women. Similar to HDL-C and estrogen, Vitamin D levels decreased significantly in T2DM postmenopausal women compared to pre-menopause group.
| Premenopause | Postmenopause | p | |
|---|---|---|---|
| Age (y) | 43.16 ± 4.2 | 59.59 ± 10.08 | <0.001* |
| Body weight (Kg) | 59.59 ± 10.08 | 70.01 ± 16.1 | <0.001* |
| BMI (Kg/m2) | 24.49 ± 7.8 | 34.41 ± 7.1 | <0.001* |
| Waist circumference (cm) | 89.05 ± 10.15 | 93.99 ± 8.9 | <0.001* |
| Estradiol (pg/ml) | 70.57 ± 4.51 | 13.01 ± 2.34 | <0.001* |
| Vitamin-D (nmol/l) | 70.1 ± 16.1 | 61.29 ± 11.9 | <0.001* |
| HbA1C (%) | 6.70 ± 0.23 | 7.25 ± 1.40 | <0.001* |
| FBG (mmol/l) | 4.72 ± 0.35 | 5.03 ± 0.38 | <0.001* |
| TC (mmol/l) | 4.59 ± 0.30 | 4.89 ± 0.42 | <0.001* |
| Tg (mmol/l) | 1.61 ± 0.07 | 1.64 ± 0.08 | <0.001* |
| HDL (mmol/l) | 1.59 ± 0.34 | 1.04 ± 0.43 | <0.001* |
| LDL (mmol/l) | 3.55 ± 0.87 | 4.27 ± 0.83 | <0.001* |
Table 1. Anthropometric and biochemical studies of the study population.
Correlation between vitamin D and other variables like lipid profile and glycemic indices (HbA1C and FBG) performed by Pearson’s correlation is presented in Table 2. It was found that Vitamin-D and HbA1C were negatively correlated in postmenopausal T2DM women compared to premenopausal group (r=-0.20; P<0.001). FBG and Tg were positively correlated with vitamin-D in postmenopausal women. LDL-C was negatively correlated with vitamin-D and statistically significant among the two groups studied (r=-0.16 ad r=-0.11 in pre and postmenopausal T2DM women respectively; p<0.05). Interrelationship between vitamin D and adiposity markers like weight, BMI and WC in postmenopausal T2DM women are shown in Table 3. Vitamin-D showed an inverse association with BMI and WC in postmenopausal T2DM women at P<0.05 (r=-0.14 and -0.16 respectively at p<0.05). Table 4 depicts the correlation between obesity markers and other variables in postmenopausal T2DM patients. BMI and WC exhibited significant negative correlation with vitamin D, and HDL concentrations and positively associated with LDL-C in postmenopausal women.
| Vitamin -D | Premenopause | Postmenopause | ||
|---|---|---|---|---|
| Pearson correlation (r) |
p | Pearson correlation (r) |
p | |
| Age | -0.02 | 0.65 | -0.14 | 0.01** |
| HbA1C | 0.002 | 0.96 | -0.2 | 0.0004* |
| FBG | -0.007 | 0.89 | 0.03 | 0.52 |
| TC | -0.01 | 0.74 | -0.01 | 0.77 |
| Tg | -0.05 | 0.36 | 0.02 | 0.79 |
| HDL | 0.13 | 0.01** | 0.02 | 0.68 |
| LDL | -0.16 | 0.003** | -0.11 | 0.04** |
Table 2. Correlation between vitamin D, age, HbA1C, FBG and lipid profile in pre and postmenopausal women by Pearson’s correlation.
| Vitamin-D | Pearson correlation (r) | p |
|---|---|---|
| Body weight | -0.07 | 0.1 |
| BMI | -0.14 | 0.01** |
| Abdominal fat (WC) | -0.16 | 0.003** |
| HbA1C | -0.2 | 0.004** |
| Tg | 0.02 | 0.7 |
| LDL | -0.11 | 0.04** |
Table 3. Regression correlation between vitamin D, adiposity and metabolic parameters in post-menopausal T2 DM women.
| Body weight | BMI | WC | ||||
|---|---|---|---|---|---|---|
| r | p | r | p | r | p | |
| Age | -0.02 | 0.66 | 0.01 | 0.8 | 0.03 | 0.59 |
| Vit-D | 0.07 | 0.1 | -0.14 | 0.01** | -0.16 | 0.03** |
| HbA1C | -0.04 | 0.4 | -0.14 | 0.01** | -0.027 | 0.63 |
| FBG | -0.03 | 0.5 | -0.04 | 0.4 | 0.066 | 0.24 |
| TC | 0.07 | 0.19 | 0.13 | 0.02** | 0.028 | 0.62 |
| Tg | -0.01 | 0.7 | -0.04 | 0.39 | -0.07 | 0.17 |
| HDL | -0.13 | 0.019** | -0.18 | 0.001** | -0.004 | 0.9 |
| LDL | -0.01 | 0.85 | -0.15 | 0.008** | 0.01 | 0.77 |
Table 4. Correlation between obesity markers and other variables in postmenopausal T2DM women.
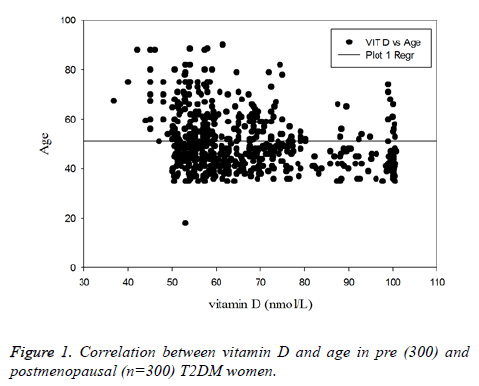
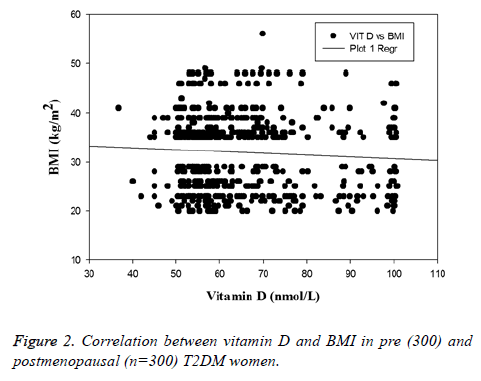
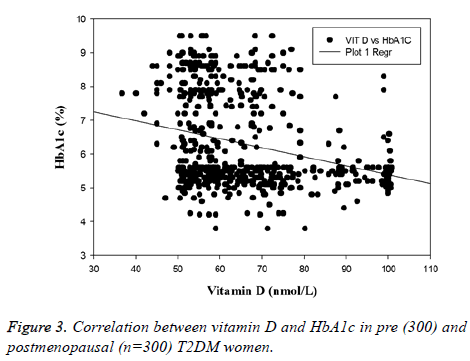
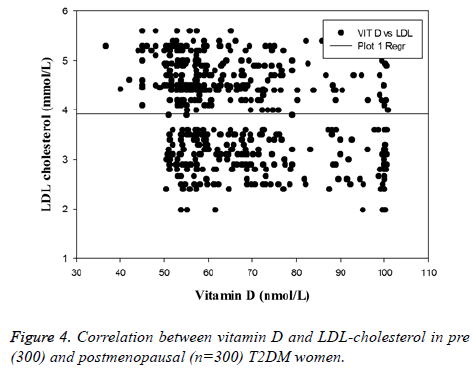
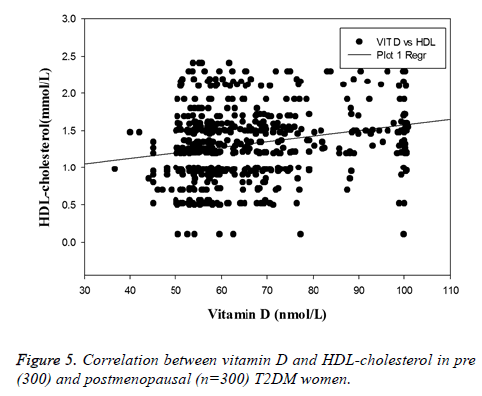
The main hallmark of the present study was the decreased levels of vitamin D were strongly associated with increased BMI and adipocity and abnormal lipid homeostasis in postmenopausal women. Postmenopausal women have higher LDL, HbA1c (p<0.001) and lower vitamin D and HDL-C (p<0.001) compared to premenopausal T2DM women. Association of vitamin D with some important variables like HbA1c, BMI, LDL-C and HDL-C in pre and postmenopausal T2DM women are depicted in Figures 1-5. Vitamin D and WC exhibited significant inverse correlation (p<0.05) indicating that accumulation of body fat has detrimental effect on serum vitamin D levels. Vitamin D was negatively correlated with BMI and LDL-C in postmenopausal women compared to premenopausal women (Figures 2 and 4).
Discussion
HbA1c is considered as an important marker for the assessment of glycemic control in diabetes and DM-induced complications [11]. The parameters of lipid profile-TC, Tg and LDL-C increased significantly (p<0.001) in postmenopausal women compared to premenopausal women. These findings are in accordance with Mascarenhas-Melo et al. [12]. In postmenopausal women, the increased level of Tg could be a result of several mechanisms like insulin resistance, overproduction of Tg rich lipoproteins and increased clearance of HDL-C which might be due to decreased estrogen synthesis. Hypertriglyceridaemia can lead to the development of atherosclerosis as a result of altered HDL metabolism.
Clinical and epidemiological data have provided evidence of an inverse relationship between low concentration of HDL-C and an increased risk for CVD [13]. HDL particles not only mediate reverse cholesterol transport (RCT) but also exhibit anti-oxidant, anti-inflammatory, anti-thrombotic and vasodilatory activities [14]. The changes in the concentration of HDL-C and HDL particles composition after menopause have been subject of controversy. The decrease HDL-C in postmenopausal T2DM women (p<0.001) in present investigation is in accordance with the findings of Chaudhari et al. [15].
Additionally, changes in lipid profile are attributed to an increase in abdominal adiposity during menopausal transition. However, one of the physiological changes that occur during menopause is increase in body weight. Most studies have shown that weight gain is linked to menopausal transition only while others found that weight gain during the menopausal transition, seems to be attributable to aging rather than to the menopausal transition itself [16]. In the present study we found that the weight and BMI of premenopausal women was lower compared to postmenopausal women. In addition to overall weight gain, menopause is also linked to changes in body composition and fat distribution [17]. With increasing postmenopausal age, lean body mass decreases while fat mass increases, predominantly in the abdominal area [18]. This augmented visceral adipose tissue (VAT) is positively associated with cardiovascular risk factors and metabolic diseases and it is considered one of the components of the metabolic syndrome observed as in diabetes [8].
Hypovitaminosis D is a risk factor for many chronic diseases like diabetes mellitus [19]. In menopause, vitamin D deficiency occurs primarily due to activation of enzyme activating vitamin D and its receptors, the VDR on account of decreased estrogen in this group of females. Vitamin D was found to be negatively correlated with increased age and HbA1C in postmenopausal women explaining the menopausal effect in aged women. Regression analysis revealed positive correlation between HDL-C and vitamin-D in pre and post-menopausal groups, which was statistically significant in premenopausal group (p<0.05). Decreased vitamin-D was negatively correlated with increased LDL in both pre and postmenopausal T2DM women respectively (r=-0.16, p<0.005 and r=-0.11, p<0.05).
To add to the better understanding of the association of vitamin D with obesity, metabolic parameters like weight/BMI, WC were measured in the study population. In the present study, vitamin D exhibited negative correlation with BMI and WC at p<0.05 and positively associated with HDL-C in postmenopausal T2DM women. The association of BMI and WC (r=-0.14, p=0.01; r=-0.16, p=0.003 respectively) with vitamin D status were more pronounced than that of body weight (r=-0.07, p=0.1), suggesting that BMI and WC represents a more powerful predictor of CVD risk factor with underlying low vitamin D status in postmenopausal T2DM. There are several potential mechanisms by which obesity could contribute to decreased vitamin D levels. Sequestration of vitamin D by adipose tissue may contribute to low circulating vitamin D concentrations in obese individuals [20]. Similar to our findings, association of lipid profile parameters in T2DM patients were found in earlier study [21]. Vitamin D may decrease serum Tg through a regulatory action that increases the activity of lipoprotein lipase in persons with obesity [22]. Correlation between vitamin-D and HDL-C was positive but not significant. Decreased levels of HDL-C is not only associated with the menopause status but other factors like gain in weight or may be due to lack of physical activity and metabolic diseases such as diabetes may play a crucial effect [23].
Vitamin D deficiency has been reported previously in Saudi Arabia mostly on diabetic males and females in comparison to non-diabetic subjects [24]. Some clinical trials have also studied vitamin D in postmenopausal women. Also vitamin D correlation in diabetes subjects has been reported from different regions of Saudi Arabia [25], but the present study was focused to investigate correlation of vitamin D levels with glycemic and lipid indices in diabetic women in relation to menopause status. The present study is the first of its kind to study such correlation and specifically in Riyadh, the central region of Saudi Arabia. The current study exhibited significant correlation between decreased vitamin D with LDL-C in postmenopausal women. As it is investigated that HDL decreases in postmenopausal women, it was noticed that although HDL decreases in postmenopausal women but decrease was non-significant. In fact HDL was found to be negatively associated with BMI indicating that HDL levels are not only regulated by vitamin D but also the metabolic changes that occur on account of menopause. Nevertheless LDL correlation was found to be prominent with vitamin D and hence conclusion was validated with respect to LDL. In conclusion, the data indicate a significant association between low Vitamin D and increased cardiovascular risk factors in postmenopausal women with T2DM. Diminished levels of vitamin D with increased BMI and increased LDL-C aggravates or increases the risk for the diabetic vascular complications and hence may act as predictive markers in diagnosis of cardiovascular diseases in patients with T2DM. Adopting strategies to control these mechanisms before menopause may improve the cardiovascular risk profile in these women.
Acknowledgements
The authors are grateful to the “Research Center of the ‘Center for Female Scientific and Medical Colleges’, Deanship of Scientific Research, King Saud University and the Management Prince Sultan Military Medical City, Riyadh, K.S.A for providing samples and facilities for completion of the study.
References
- Krishna SG, Bubblu T, Amarabalan R. Role of vitamin D in diabetes. J Endocr Metab 2011; 1: 47-56.
- Moreira TS, Hamadeh MJ. The role of vitamin D deficiency in the pathogenesis of type 2 diabetes mellitus. European J Clin Nutrition 2010; 5: 155-165.
- Al-Nozha MM, Al-Maatouq MM, Al-Mazrou YY, Al-Harthi SS, Arafah MR, Khalil MZ, Khan NB, Al-Khadra A, Al-Marzouki K, Nouh MS, Abdullah M, Attas O, Al-Shahid MS, Al-Mobeireek A. Diabetes mellitus in Saudi Arabia. Saudi Med J 2004; 25: 1603-1610.
- Wacker M, Holick MF. Vitamin D-effects on skeletal and extraskeletal health and the need for supplementation. Nutrients 2013; 5: 48.
- Karhapaa P, Pihlajamaki J, Porsti I, Kastarinen M, Mustonen J, Niemela O, Kuusisto J. Diverse associations of 25-hydroxyvitamin D and 1, 25-dihydroxy-vitamin D with dyslipidaemias. J Inter Med 2010; 268: 604-610.
- Ponholzer A, Temml C, Rauchenwald M, Marszalek M, Madersbacher S. Is the metabolic syndrome a risk factor for female sexual dysfunction in sexually active women? I J Impo Res 2008; 100-104.
- Wu SI, Chou P, Sai ST. The impact of years since menopause on the development of impaired glucose tolerance. J Clin Epidemiology 2001; 54: 117-120.
- Carr MC. The emergence of the metabolic syndrome with menopause. J Clin Endocrinol Metab 2003; 88; 2404-2411.
- Peters PW, Westendorp IC, Hak AE, Grobbee DE, Stehouwer CD, Hofman A, Witteman JC. Menopausal status and risk factors for cardiovascular disease. J Int Med 1999; 246: 521-528.
- Friedewald WT, Levy RI, Fredrickson DS. Estimation of the concentration of low-density lipoprotein cholesterol in plasma. Clin Chem 1972; 18: 499-502.
- Talaat M, Nasr A, . Alsulaimani AA, Alghamdi H, Alswat KA, Almalki DM, Abushouk A, Saleh AM, Allam G. Association between type 1, type 2 cytokines, diabetic autoantibodies and 25 hydroxyvitamin D in children with type 1 diabetes. J Endocrinol Investigation 2016; 39: 1425-1434.
- Mascarenhas MF, Marado D, Palavra F, Sereno J, Coelho Á, Pinto R, Teixeira-Lemos E, Teixeira F, Reis F. Diabetes abrogates sex differences and aggravates cardiometabolic risk in post-menopausal women. Cardiovascular Diabetology 2013; 12: 61-68.
- Santos Gallego CG, Badimon JJ. High-density lipoprotein and cardiovascular risk reduction: Promises and realities. Rev Esp De Cardiologia 2012; 65: 305-308.
- Ali KM, Wonnerth A, Huber K, Wojta K. Cardiovascular disease risk reduction by raising HDL cholesterol current therapies and future opportunities. Br J Pharmacol 2012; 167: 1177-1194.
- Chaudhari P, Kushwaha RS, Raturi S, Naithani S, Sailwal S, Sharma S, Bhat K, Masood T, Singh RK. A comparative study of circulating plasma lipid components and superoxide dismutase activity in pre and postmenopausal women. Int J Res Med Sci 2016; 4: 3801-3805.
- Al-Safi ZA, Polotsky AJ. Obesity and menopause. Best Prac Res Clin Obstet Gynaecol 2015; 29: 548-553.
- Beltran-Sanchez H, Harhay M, McElligott S. Prevalence and trends of metabolic sydrome in the adult US population, 1999-2010. J Am Coll Cardiol 2014; 62: 697-703.
- Franklin RM, Ploutz-Snyder L, Kanaley JA. Longitudinal changes in abdominal fat distribution with menopause. Metabolism 2009; 58: 311-315.
- Wajchenberg BL. Subcutaneous and visceral adipose tissue: their relation to the metabolic syndrome. Endo Rev 2000; 21: .697-738.
- Ozuguz U, Oruc S, Ulu MS. Does vitamin D have any role in the improvement of diabetic peripheral neuropathy in type 1 diabetic patients? J End Investigation 2016; 39: 1411-1417.
- Saedisomeolia A, Taheri E, Djalali M, Moghadam M, Qorbani M. Association between serum level of vitamin D and lipid profiles in type 2 diabetic patients in Iran. J Diab Met Disorders 2014; 13: 1-5.
- Jorde R, Grimnes G. Vitamin D and metabolic health with special reference to the effect of vitamin D on serum lipids. Prog Lipid Res 2011; 50: 303-312.
- Taskinen MR, Boren J. New insights into the pathophysiology of dyslipidemia in type 2 diabetes. Atherosclerosis 2015; 239: 483-495.
- Al-Khadi H. Vitamin D status in Saudi women with type 2 diabetes mellitus: a case control study. Int J Recent Adv Multidiscip Res 2014; 1: 33-36.
- Alhumaidi M, Agha A, Dewish M. Vitamin D deficiency in patients with type-2 diabetes mellitus in Southern Region of Saudi Arabia. MAEDICA 2013; 8: 231-236.
