ISSN: 0970-938X (Print) | 0976-1683 (Electronic)
Biomedical Research
An International Journal of Medical Sciences
- Biomedical Research (2016) Volume 27, Issue 3
Synthesis and characterization of veratryl alcohol imprinted and nonimprinted methacrylamido polymers.
Turgay Tay*
Department of Chemistry, Faculty of Science, Anadolu University, 26470 Eskisehir, Turkey
- *Corresponding Author:
- Turgay Tay
Department of Chemistry
Faculty of Science Anadolu University, Turkey
Accepted date: May 12, 2016;
In this study, the synthesis and structural properties of a Molecularly Imprinted Polymer (MIP) and a Nonimprinted Polymer (NIP) bearing Fe-porphyrin moiety and amino acid moieties including Histidine (His), Tryptophan (Trp) and Arginine (Arg) are presented. The imprinted and nonimprinted polymeric beads were synthesized by suspension polymerization technique and characterized by using FT-IR spectroscopy, SEM, BET and TGA techniques, and Zeta potential measurements. SEM images indicated that the MIP beads have more porous surface than that of the NIP beads. The BET analysis showed that the surface area of MIP is 147.01 m2/g, which is larger than that of NIP (49.50 m2/g). The effects of initial concentration and contact time for the adsorbtion veratryl alcohol on the polymeric beads were investigated on a batch system. Adsorption isotherms fit better in Langmuir isotherm than Freundlich isotherm and the adsorption capacities of the NIP and the MIP were calculated as 19.42 mg/g and 10.52 mg/g, respectively.
Keywords
Polymer, Enzyme, Lignin peroxidase, Porphyrin, MIP.
Introduction
The extracelluar enzyme (lignin peroxidase etc.), originally extracted from white-rot fungus P. Chrysosporium and responsible for the biodegrading of lignin [1-3] has become an attractive enzyme because of its possible use in various biotechnological applications such as delignification of lignocelluse materials [4], depleting of oil reserves [5], removing of resistant organic pollutants from the drainage pulp and paper industries [6-13]. Published studies indicated that lignin peroxidase can catalyze the oxidation of aromatic compounds and thus reduces them to environmentally friendly products [14-18]. Peroxidases naturally exist in most of the living organisms and many of them contain ferric protoporphyrin IX prosthetic group [1].
Oxidative activity of lignin peroxidase is ensured by π cation radical on Fe-porphyrin complex [19,20]. Catalytic activity of lignin peroxidase (LiP) has been imitated by devising biomimetic peroxidases containing protoporphyrin IX or metallophthalocyanines [21-23]. Such biomimetic catalysts have ability to activate hydrogen peroxide (H2O2) and thus they were tested as catalysts for the oxidative degradation of the lignin structures [24-29]. Synthetic metalloporphyrins also offer LiP like catalytic activities [30]. Moreover, metalloporphyrins are not much sensitive against excess H2O2, and are thus more potentially interesting to industrial applications [30].
The studies on the development of mimic enzymes have focused on the design and preparation of Molecularly Imprinted Polymers (MIPs) as artificial catalysts [31-34]. The preparation of a MIP having high affinity towards a target compound is composed of three steps. In the first step, a complex is formed between the polymerizable functional monomer and the template compound through covalent or noncovalent interactions. The chemical features and three dimension of the template compound are crucial for the preparation of activity-recognition cavities. Second step is the polymerization step where the functional monomer is polymerized in the presence of an appropriate cross-linker. In the last step, the template compound is removed from the polymeric structure by washing with a suitable solvent. In this study, a veratryl alcohol imprinted polymer was prepared to mimic the structure of natural lignin peroxidase.
The template compound veratryl alcohol, methacrylamido monomers pending iron porphyrin and amino acids including histidine (His), tryptophan (Trp), and arginine (Arg) which exist in the active site of the lignin peroxidase were copolymerized in the presence of the crosslink agent ethylene glycol dimetharcrylate. After removal of the template, the synthetic polymer mimicing lignin peroxidase was obtained. A nonimprinted polymer was prepared in a similar way in the absence of the template veratryl alcohol. The structural characterizations of aforementioned polymers were elucidated by various analysis including FT-IR spectra, SEM micrographs, BET measurements, TGA thermographs and Zeta potential measurements.
Material and Methods
Materials and reagents
Benzaldehyde, pyrrole, methacryloyl chloride, hydroxyethyl methacrylate (HEMA), histidine, tryptophan, arginine were obtained from Merck. 2,2’-Azobis(2-methylpropionitrile) (AIBN), and solvents were purchased from Sigma. Ethylene glycol dimethacrylate (EDMA), veratryl alcohol, poly(vinyl)alcohol (MW 89000-98000) were purchased from Aldrich. For preparative TLC, Silica gel 60 GF254 coated glass plates (20 × 20 cm, Merck) were used.
Instrumentation
1H NMR spectra of the porphyrins, methacrylamido histidine (MAH), methacrylamido tryptophan (MATrp), methacrylamido arginine (MAArg) were recorded with a 500 MHz Bruker DPX-500 spectrometer at Anadolu University BİBAM. For FT-IR spectra, a Perkin Elmer 100 FT/IR spectrometer was used. A Schimadzu UV-2450 spectrophotometer was employed to record the UV and Visible spectra. The SEM micrographs of the beads were obtained from Oxford Instruments 7430 Field Emission Gun Scanning Electron Microscope (FEG-SEM). Thermal gravimetric analyses of the polymers were obtained with a Seteram (Labsys) Thermogravimetric/Differential Thermal Analyzer. For Zeta-size and surface analysis of the polymer beads, a Zeta Sizer Nano Series (Nano- ZS) Malvern Instrument and Surface analyzer Quantachrome Inst., Nova 2200e were used, respectively. Zeta potentials of the beads (10 mg) suspended in 25 mL distilled water were measured as a function of pH using a Malvern Zeta sizer Nano Series equipped with an MPT2 multi-purpose titrator. Hydrochloric acid (0.025 and 0.5 M) and sodium hydroxide (0.15 M) solutions were used to adjust the pH values during the zeta potential measurements.
Synthesis of methacrylamido functionalized porphyrin
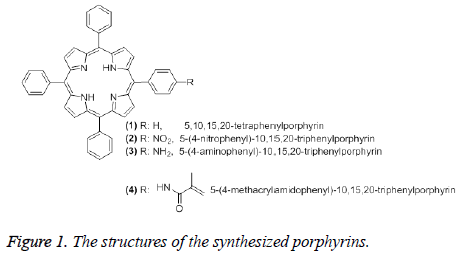
Synthesis of 5,10,15,20-tetraphenylporphyrin (1): 1 was synthesized by following the Lindsey method [35-37]. Benzaldehyde (2.1 g, 20 mmol), pyrrole (1.338 g, 20 mmol) and borontrifluoride etherate (1.5 g, 10.5 mmol) were mixed together in 250 mL freshly distilled chloroform. The mixture was stirred for 2 h at room temperature under nitrogen, then it was heated up to 40°C and stirred for 5 h. After it was kept at room temperature overnight, 2,3,5,6-tetrachloro-1,4- benzoquinone (6.25 g, 25.4 mmol) was added to this solution. The mixture was boiled under reflux condition for 1 h. After checking by TLC, the mixture was cooled to room temperature and chloroform was evaporated under vacuum. The residue was washed with methanol extensively to give pure 1 (Figure 1). The 1H NMR, FTIR, UV/Vis spectral data of 1 were in agreement with those given in the literature [38].
Synthesis of 5-(4-nitrophenyl)-10,15,20-triphenylporphyrin (2): 2 was synthesized by following the Luguya method [39] as described in one of our previously published work [38].Sodium nitrite (0.1 g, 145 mmol) was added to a solution of 1 (0.5 g, 0.815 mmol) in trifluoroacetic acid. The mixture was stirred for 3 minutes at room temperature and the reaction was quenched by adding 5% NH4OH solution until neutralization. Then the mixture was extracted with dichloromethane (6 × 100 mL). The organic phase was washed with sodium bicarbonate solution. Dichloromethene was evaporated to dryness under vacuum. The crude product was dissolved using a suitable solvent and it was purified by column chromatography (Figure 1). The 1H NMR, FTIR, UV/Vis spectral data of 2 were in agreement with those given in the literature [38].
Synthesis of 5-(4-aminophenyl)-10,15,20- triphenylporphyrin (3): 3 was prepared by following the Hasegawa method [40] as described in one of our published work [38]. 20% HCl (25 mL) and SnCl2.2H2O (0.5 g, 2.2 mmol) was added to 2 (0.1 g, 0.152 mmol). This mixture was stirred for 25 min at 40°C. After the mixture was cooled to room temperature, it was neutralized by adding 26% NH4OH (10 mL). 3 was extracted from the aqueous solution using chloroform. Chloroform was evaporated under vacuum and the residue was washed with 5% NH4OH solution and water. The crude product was purified by column chromatography (Figure 1). The 1H NMR, FTIR, UV/Vis spectral data of 3 were in agreement with those given in the literature [38].
Synthesis of 5-(4-methacrylamidophenyl)-10,15,20- triphenylporhyrin (4): 4 was prepared by following the Hasegawa method [40] as described in one of our published work [38]. Pyridine (2 mL) was added to the mixture of 3 (0.15 g, 0.239 mmol) and methacryloyl chloride (1.07 g, 10.2 mmol) in THF (10 mL) at 0-5°C. The mixture was stirred for 2 h at room temperature. The solvent was evaporated under vacuum. The residue was dissolved in 5% NH4OH and extracted with CHCl3. The chloroform phase was evaporated under vacuum. The crude product was purified by using preparative silica gel TLC plates using chloroform as developing solvent (Figure 1). The 1H NMR, FTIR, UV/Vis spectral data of 4 were in agreement with those given in the literature [38].
Synthesis of 5-(4-methacrylamidophenyl)-10,15,20- triphenylporhyrin (4): 4 was prepared by following the Hasegawa method [40] as described in one of our published work [38]. Pyridine (2 mL) was added to the mixture of 3 (0.15 g, 0.239 mmol) and methacryloyl chloride (1.07 g, 10.2 mmol) in THF (10 mL) at 0-5°C. The mixture was stirred for 2 h at room temperature. The solvent was evaporated under vacuum. The residue was dissolved in 5% NH4OH and extracted with CHCl3. The chloroform phase was evaporated under vacuum. The crude product was purified by using preparative silica gel TLC plates using chloroform as developing solvent (Figure 1). The 1H NMR, FTIR, UV/Vis spectral data of 4 were in agreement with those given in the literature [38].
Synthesis of 5-(4-methacrylamidophenyl)-10,15,20- triphenylporphinatoiron chloride
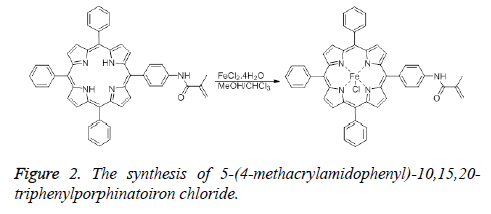
The insertion of iron into 4 was achieved using two different methods. In the first method, a solution of FeCl2.4H2O (163 mg, 0.82 mmol) in methanol (15 mL) was added to the solution of 5-(4-methacrylamidophenyl)-10,15,20-triphenylporphyrin (300 mg, 0.41 mmol) in chloroform (15 mL). This mixture was stirred for 48 h at room temperature. After checking with TLC, the reaction mixture was filtered through a Gooch crucible. The solvent was evaporated under reduced pressure, then the residue was purified by using preparative silica gel TLC plates (Figure 2).
In the second method, pyridine (5 mL) was added to the mixture of 5-(4-aminophenyl)-10,15,20-trifenilporphyrin (360 mg, 0.49 mmol) and FeCl2.4H2O (200 mg, 1 mmol) in DMF (35 mL). The mixture was boiled under reflux condition for 24 h. After checking with TLC, the reaction mixture was filtered through a Gooch crucible. The solvent was evaporated under reduced pressure, then the residue was purified by using preparative silica gel TLC plates. FTIR (νmax ,cm-1): 3314 (sec. amide), 3000 (aromatic CH), 1590 (C=C), 1345 (C=N), 1000 (Fe-N), 364 (Fe-Cl). UV-Vis (CHCl3, λmax nm): 420 (Soret), 514, 582 (Q bands).
Synthesis of methacrylamido histidine (MAH), methacrylamido tryptophan (MATrp), methacrylamide arginine (MAArg)
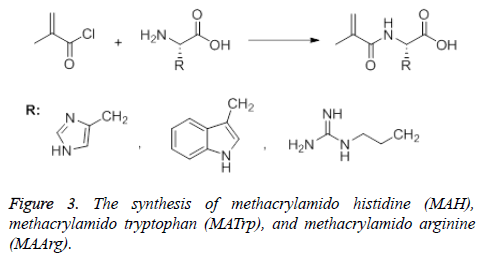
The synthesis of Methacrylamido Histidine (MAH) was carried out using two different methods. In the first method, Methacrylamido Benzotriazole (MABt) was synthesized according to the Hür method [41]. Benzotriazole (8.60 g, 72.2 mmol) was dissolved in dichloromethane and thionyl chloride was added to it. This mixture was stirred for 10 minutes before methacryclic acid (1.72 g, 20.0 mmol) was added. Stirring was continued for 2 h at roon temperature and then the resulting white precipitate was filtered. The filtrate was washed with 2 × 50 mL CH2Cl2 and 3 × 60 mL 2 M NaOH. The solvent was removed with a rotary evaporator and a yellow oily product was obtained. This product (MABt) was used in the synthesis of methacrylamido histidine. Histidine (1.10 g, 7.1 mmol) was dissolved in 1 M NaOH (25 mL) and MABt (1.06 g, 5.2 mmol) dissolved in 1,4-dioxane was added dropwise to the solution. The reaction medium was stirred at room temperature for 20 min and the progress of the reaction was checked with TLC. At the end of the reaction, 1,4-dioxane was evaporated. The remaining solution was treated with water, washed with ethyl acetate (3 × 50 mL) and neutralized with 10% HCl solution. After the water phase was removed, the yellow product (MAH) was obtained. In the second method, methacrylamido histidine was synthesized according to the Sener method [42]. Briefly, histidine (1.61 g, 10.4 mmol) was dissolved in 150 mL CH3OH-H2O (1:2) and methacryl chloride (1 mL) was added dropwise at room temperature to the reaction medium. The mixture was stirred for 2 h at room temperature. After evaporation of the solvent, a yellow precipitate (product) was obtained (Figure 3). MATrp and MAArg were synthesized using similar methods. MAH monomer; FTIR (νmax ,cm-1): 3400 (OH, NH), 1653 (C=O band), 1529 (amid band); 1H NMR (CDCl3, δ): 2.84 (3H, t, J:7.08 Hz), 3.07-3.21 (2H, m, CH2), 4,82-4.87 (1H, m, methin), 5.26 (1H, s, vinyl H), 5.58 (1H, s, vinyl H), 6.26 (1H, d, J:7.4 Hz, NH), 7.06-7.22 (5H, m,aromatic), 10.09 (1H, s, OH), MATrp monomer; FTIR (νmax, cm-1): 3394 (OH ve NH), 1654 (C=O band), 1457 (amid band); 1H NMR (DMSO, δ): 1.8 (3H, s, CH3), 2.2-2.3 (2H, s, CH2=CC= O), 2.7-2.8 (CHC=O), 4.5 (d, 2H, -CH2), 6.9 -7.5 (m, 5H, indole-H), 7.9 (s, 1H, NH amide), 10.8 (s, 1H, indole NH), MAArg monomer; FTIR (νmax ,cm-1): 3414 (OH ve NH) 1615 (C=O band), 1452 (amid band); 1H NMR (CDCl3, δ): 1.8 (3H,s,CH3), 4.1 (CH-C=O), 5.31-5.67 (-CH2 (ethylene)), 7.36-7.67 (-NH).
Synthesis of NIP
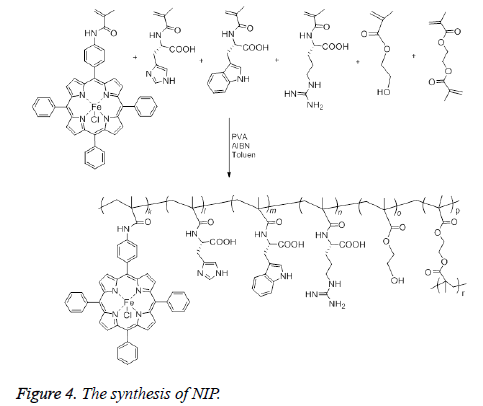
The synthesis of NIP was achieved as follows: After addition of 100 mL of distilled water and PVA (0.2 g) as a stabilizer to a two neck flask (250 mL) equipped with a stirrer, the mixture was heated and stirred until PVA dissolved completely. Then, the mixture was cooled to room temperature. Toluen (10 mL), 5-(4-methacrylamidophenyl)-10,15,20-triphenylporphinatoiron (0.5 mmol), HEMA (26.5 mmol), MATrp (1.0 mmol), MAArg (1.0 mmol), MAH (1.0 mmol) and EDMA (70 mmol) were added to the mixture sequentially. The resulting suspension was heated to 65°C under nitrogen, then AIBN (0.1 g) was added to the mixture to initiate polymerization. The mixture was stirred continuously at about 600 rpm for 4 h and then the polymerization was continued for another 2 h at 90°C. After cooling the reaction mixture, the dispersion phase was decanted and polymeric beads were washed with 100 mL of distilled water three times, 100 mL 50% ethanol-water mixture and 100 mL ethanol, and dried in a vacuum desiccator at 60°C (Figure 4). FT-IR (νmax ,cm-1): 3446 (OH ve NH), 1732 (C=O band), 1458 (amid band), 954 (Fe-N).
Synthesis of MIP
The synthesis of MIP was carried out in the same way as described in the synthesis of NIP. In the synthesis, veratryl alcohol was used as a model compound for lignin and added 50 mmol to the medium along with the other constituents in the polymerization recipe. The template veratryl alcohol was removed from the beads after refluxing them in 0.1 M NaOH methanol-water (25% MeOH by mass) solution for 3 h. Then the beads were filtered and complete removal of veratryl alcohol was confirmed after taking the UV/Vis spectrum of the filtrate. Finally the beads of MIP were washed with methano (50 mL), then with water (50 mL) and dried in a vacuum oven. FT-IR (νmax ,cm-1): 3444 (OH ve NH), 1731 (C=O band), 1455 (amid band), 955 (Fe-N).
Veratryl alcohol adsorption studies
The adsorption of the target compound veratryl alcohol on the MIP and NIP were studied in batch-mode. The effect of adsorption time and initial veratryl alcohol concentration on adsorption capacity of the polymers were investigated to determine the optimum conditions at room temperature. For this purpose, 20 mL solution of veratryl alcohol was added to 10 mg of each polymer (MIP and NIP). The solution was stirred at 150 rpm using a magnetic stirrer at room temperature. The equilibrium concentration of each solution was determined from the absorbance of the veratryl alcohol solution measured at 277 nm by the spectrophotometer and using a calibration curve.
Results and Discussion
FT-IR spectra of the polymers
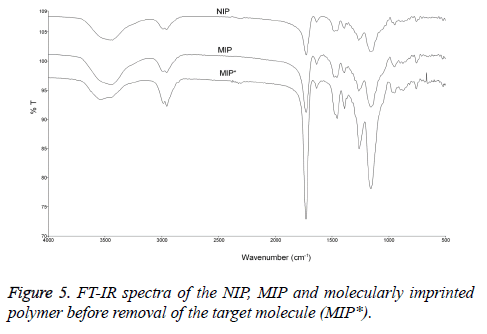
FT-IR spectral analysis of the MIP and NIP are shown in Figure 5. Both MIP and NIP had noticeable peaks at 3440-3470 cm-1. These peaks are for OH and NH stretches and can be associated with amino acids (arginine, tryptophan, histidine), methacrylamido porphyrin and EDMA moieties in the polymers. The carbonyl stretching peaks were also observed in both MIP and NIP at 1731-1732 cm-1. The amide groups were observed at 1455-1458 cm-1. Broad bands at 954-955 cm-1 indicate a metal-nitrogen (Fe-N) bond. In addition, the peak at 759-762 cm-1 band represents the out of plane bending of the peak bond NH. The functional groups in MIP* are similar to those in MIP and NIP nevertheless the intensity of stretching signal of hydroxyl group of MIP* at 3530 cm-1 was stronger than those of MIP and NIP, possible due to the presence of veratryl alcohol.
Surface analysis studies
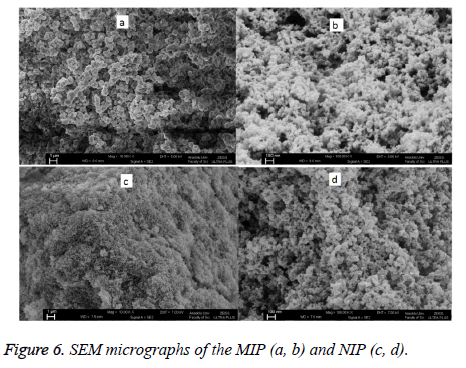
The SEM micrographs of MIP and NIP are shown in Figure 6. The bead sizes and surface morphologies of MIP and NIP were found to be different. In addition NIP was observed to have a smoother surface whereas MIP has a highly porous surface and core which lead to a higher surface area.
The reason for this is that when MIP was synthesized, pores which sensitive to veratryl alcohol molecules were formed on the surface of the polymer with the distancing of veratryl alcohol, which had been placed in the atmosphere as a template molecule, from the polymer synthesis. Indeed the BET measurements further proved the conclusions drawn from the SEM micrographs (Table 1). The surface area of MIP was found to be 147.01 m2/g, thus larger than that of NIP, which was 49.50 m2/g. Also, the pore volume for MIP was found to be larger than that of NIP. However the pore size of MIP was found to be smaller than that of NIP.
| Polymer | Surface Area (m2/g) | Micropore Volume (cm3/g) | Micropore Area (m2/g) | External Surface Area (m2/g) | Pore size (Å) |
|---|---|---|---|---|---|
| MIP | 147.01 | 0.036 | 75.31 | 71.70 | 27.0 |
| NIP | 49.50 | 0 | 0 | 49.50 | 37.78 |
Table 1: Surface and pore characteristics of the MIP and NIP.
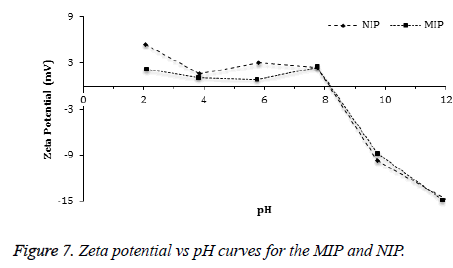
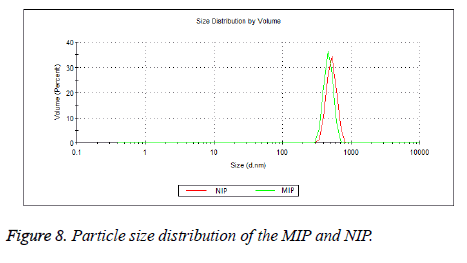
The zeta potential measurements of MIP and NIP were measured in the pH range from 2 to 12. According to Figure 7, the Zeta potential curves of MIP and NIP were found to be similar. The zeta potential measurements showed an Isoelectric Point (IEP) in the pH range of 8.0-8.5 for both polymers. The positive zeta potential values were observed at lower pH values as the amino groups in the polymers (MIP and NIP) were protonated in a strongly acidic medium. In addition, negative zeta potential values were observed at higher pH values because of increasing ionization of the hydroxyl groups in the polymers [43,44]. Average particle sizes and size distributions of the beads of MIP and NIP were measured using dynamic light scattering method (Figure 8). The average diameter of the beads of MIP (474 nm) was slightly smaller than that of NIP (504 nm).
Thermal behavior studies
The thermogravimetric analysis (TGA) curves of MIP and NIP are given in Figure 9. The weight losses of MIP and NIP on heating were examined up to 800°C. Decomposition of MIP was observed with weight loss occurring between 200-460°C (98%), then showing stability from 460°C to 800°C while a weight lost for NIP was observed from 230°C to 460°C (95%).
Veratryl alcohol adsorption studies
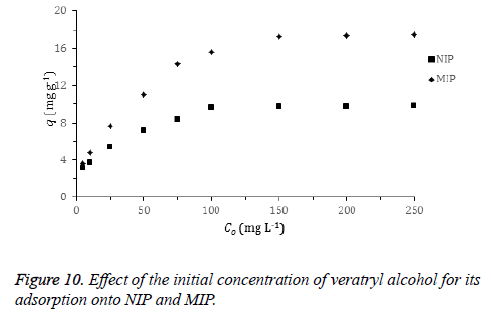
Effect of initial concentration: The plot for the effect of initial veratryl alcohol concentration on the adsorption is shown in Figure 10. The amount of the adsorbed veratryl alcohol to MIP and NIP increases with the increasing initial veratryl alcohol concentration until a certain concentration. Adsorption of the target molecule (veratryl alcohol) to recognizing sites on the MIP surface that are the result of molecular imprinting easily occurs.
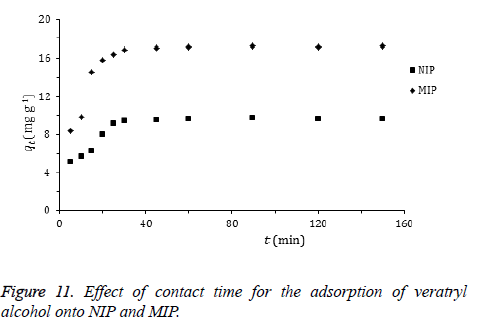
Effect of adsorption time: The effect of time on the amount of adsorbed veratryl alcohol to MIP and NIP is given in Figure 11. Adsorption of the target compound occurs very fast. This could be explained by the high surface area of the polymers as a main advantage of them in use. High amounts of veratryl alcohol molecules in the adsorption medium were adsorbed in 30 min.
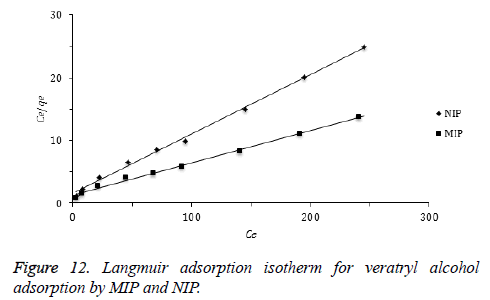
Adsorption isotherms: Langmuir and Freundlich isotherm are the most frequently used adsorption models to describe adsorption mechanisms. Langmuir adsorption isotherm defines a single adsorption layer built on surface and implies that the surface is homogeneous. The linearized Langmuir isotherm is represented by following equation.

qe: adsorption density of solute at equilibrium (mg/g), Ce: the equilibrium concentration of adsorbate (mg/L), qm: maximum monolayer coverage capacity (mg/g), KL: Langmuir isotherm constant (L/mg). Herein, to evaluate the veratryl alcohol adsorption on MIP and NIP for Langmuir isotherm model, Ce / qe versus Ce was plotted (Figure 12) and the calculated values of qm ve KL were given in Table 2.
| Polymer | Langmuir isotherm | Freundlich isotherm | ||||
|---|---|---|---|---|---|---|
| qmax (mg g-1) | KL (L mg-1) | R2 | KF (L mg-1) | n | R2 | |
| MIP | 19.42 | 0.041 | 0.995 | 2.322 | 2.52 | 0.974 |
| NIP | 10.52 | 0.065 | 0.997 | 2.147 | 3.34 | 0.966 |
Table 2: Langmuir and Freundlich adsorption isotherm parameters of veratryl alcohol onto MIP and NIP.
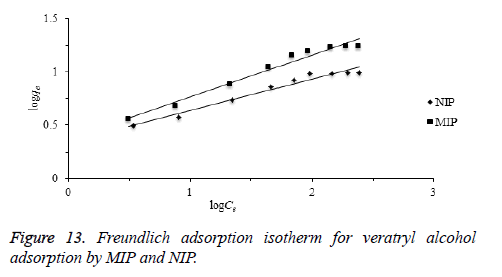
Freundlich isotherm is commonly used to describe the adsorption characteristics for the heterogeneous surface. The empirical relation between the concentration of a solute on the surface of an adsorbent and the concentration of the solute can be linearized by the following equation. The heterogeneity of the surface can be understood from the value of “n” constant in Freundlich equation. Based on the Freundlich isotherm model, heterogeneity of a surface increases while the 1/n closes to zero [45,46].

KF: Freundlich isotherm constant (mg/g), n: adsorption intensity, Ce: the equilibrium concentration of adsorbate (mg/L), qe the amount of substance adsorbed per gram of the adsorbent at equilibrium (mg/g). Herein, to evaluate the veratryl alcohol adsorption on MIP and NIP for Freundlich isotherm model, logqe versus logCe was plotted (Figure 13) and the calculated values of 1/n and KF were given in Table 2.
Conclusion
In summary, the MIP and NIP beads have been successfully synthesized using suspension polymerization technique. The MIP beads containing a template molecule, veratryl alcohol, have higher porous surface, surface area, pore volume and smaller pore size than those of NIP. Both polymers have similar isoelectric points ranging at pH 8.0-8.5. The adsorption studies of the prepared polymers (MIP and NIP) show that the veratryl alcohol adsorption capacity of MIP (19.42 mg/g) is higher than that of NIP (10.52 mg/g). Experimental results of veratryl alcohol adsorption on the NIP and MIP are more consistent with Langmuir isotherm than Freundlich isotherm.
Acknowledgement
Financial support of Anadolu University Research Projects Commission (Project No: 1001F35 and 1505F301) is gratefully acknowledged. I thank to Prof. Dr. Rıdvan SAY and Prof. Dr. Hayrettin TÜRK for their valuable contributions and manuscript reading.
References
- Dawei S. Veratryl alcohol: mechanism of oxidation by lignin peroxidase and role in lignin degradation. Oregon Health & Science University 1998.
- Glenn JK, Morgan MA, Mayfield MB, Kuwahara M, Gold MH. An extracellular H2O2 requiring enzyme preparation involved in lignin biodegradation by the white rot basidiomycetePliunerochaerechrysosporium.BiochemBiophys Res Commun 1983; 114: 1077-1083.
- Tien M, Kirk TK. Lignin-degrading enzyme from the hymenomycetePhanerochaerechrysosporiumburds. Science 1983; 221: 661-662.
- Harley BS, Brodo PMA, Senior PJ.Proceeding of Royal society discussion meeting on utilisation of lignocellulosic wastes.Cambridge: Cambridge University Press; 1988.
- Ralph JP. Biological processing of coal.ApplMicrobiolBiotechnol1999; 52: 16-24.
- Martinez AT. Molecular biology and structure-function of lignin degrading heme peroxidase. Enzyme Microbial Tecnol2002; 30: 425-444.
- Young RA, Akhtar M. Environmentally-friendly tecnologies for the pulp and paper industry, John Wiley and Sons, 1998, New York.
- Eriksson KE, Kirk TK.Biopulping: an overview of developments in an environmentally safe paper making technology. FEMS Microbiol Rev 1994; 13: 351-364.
- Bumpus JA, Tien M, Wright D, Aust SD. Oxidation of persistent environmental-pollutants by a white rot fungus. Science 1985; 228: 1434-1436.
- Shin KS, Kim CJ.Decolorisation of artificial dyes by peroxidase from the white-rot fungus, Pleurotusostreatus.Biotechnol Letters 1998; 20: 569-572.
- Marwaha SS, Grover R, Prakash C, Kennedy JF. Continuous biobleaching of black liquor from the pulp and paper industry using an immobilized cell system. J ChemTechnolBiotechnol1998; 73: 292-296.
- Levin L, Papinutti L, Forchiassin F. Evaluation of Argentinean white rot fungi for their ability to produce lignin-modifying enzymes and decolorize industrial dyes.BioresTechnol2004; 94: 169-176.
- Cenek N, Katerina S, Pavla E, Tomá? C, Aparna K, Elke L, Václav ?.Ligninolytic fungi in bioremediation: extracellular enzyme production and degradation rate. Soil BiolBiochem2004; 36: 1545-1551.
- Hammel KE, Kalyanaraman B, Kirk TK. Oxidation of polycyclic aromatic hydrocarbons and dibenzo[p]-dioxins by Phanerochaetechrysosporiumligninase. J BiolChem1986; 261; 16948-16852.
- Joshi DK, Gold MH. Oxidation of dimethoxylated aromatic compounds by lignin peroxidase from Phanerochaetechrysosporium.Eur J Biochem1996; 237: 45-57.
- Cameron MD, Timofeevski S, Aust SD. Enzymology of Phanerochaetechrysosporium with respect to the degradation of recalcitrant compounds and xenobiotics.ApplMicrobiolBiotechnol2000; 54: 751-758.
- Wesenberg D, Kyriakides I, Agathos SN. White-rot fungi and their enzymes for the treatment of industrial dye effluents.BiotechnolAdv2003; 22: 161-187.
- Uyama H, Kohayashi S. Enzymatic polymerization yields useful polyphenols.Chemtech 1999; 29: 22-28.
- Dolphin D, Forman A, Borg DC, Fajer J, Felton RH. Compounds I of catalase and horse radish peroxidase: pi-cation radicals. ProcNatlAcadSci USA 1971; 68: 614-618.
- Renganathan V, Gold MH. Spectral characterization of the oxidized states of lignin peroxidase, an extracellular heme enzyme from the white rot basidiomycetePhunerochuetechrysosporium. Biochemistry 1986; 25: 1626-1631.
- Cui F, Dolphin D.Metallophthalocyanines as possible lignin peroxidase models. Bioorg Med Chem1995; 3: 471-477.
- Song R, Robert A, Bernadou J, Meunier B.Sulfonated and acetamidosulfonylatedtetraarylporphyrins as biomimetic oxidation catalysts under aqueous conditions.InorgChimActa1998; 272: 228-234.
- Barbat A, Gloaguen V, Sol V, Krausz P. Aqueous extraction of glucuronoxylans from chestnut wood: new strategy for lignin oxidation using phthalocyanine or porphyrin/H2O2 system. BioresourTechnol2010; 101: 6538-6544.
- Crestini C, Saladino R, Tagliatesta P, Boschi T. Biomimetic Degradation of Lignin and Lignin Model Compounds by Synthetic Anionic and Cationic Water Soluble Manganese and Iron Porphyrins. Bioorganic Med Chem1999; 7: 1897-1905.
- Zhu W, Ford WT. Oxidation of lignin model compounds in waterwithdioxygen and hydrogen peroxide catalyzed by metal phthalocanines. J Mol Catalysis 1993; 78: 367-378.
- Hampton KW, Ford WT. Oxidation of 3,4-dimethoxybenzylalcohol in water catalyzed by iron tetrasulfophthalocyanine. J Mol Catalysis A 1996; 113; 167-174.
- Crestini C, Pastorini A, Tagliatesta P.Metalloporphyrins immobilized on motmorillonite as biomimetic catalysts in the oxidation of lignin model compounds. J Mol Catalysis A 2004; 208; 195-202.
- Kurek B, Martinez-Inigo MJ, Ataud BR, Hames C, Lequart BM. Structural Features of lignin determining its biodegrdadation by oxidative enzymes and related systems. Poly Degradation Stability 1998; 59: 359-364.
- Kapich AN, Jensen KA, Hammel KE.Peroxyl radicals are potential agents of lignin biodegradation. FEBS Lett1999; 461: 115-119.
- Lange H, Decina S, Crestini C. Oxidative upgrade of lignin-Recent routes reviewed. European Polymer J 2013; 49: 1151-1173.
- Bereli N, Andaç M, Baydemir G, Say R, Galaev IY. Protein recognition via ion-coordinated molecularly imprinted supermacroporouscryogels. J Chromatogr A 2008; 1190: 18-26.
- Odabasi M, Say R, Denizli A. Molecular imprinted particles for lysozyme purification. Materials SciEng C 2007; 27: 90-99.
- Bossi A, Bonini F, Turner AP, Piletsky SA. Molecularly imprinted polymers for the recognition of proteins: the state of the art. BiosensBioelectron2007; 22: 1131-1137.
- Pichon V, Chapuis-Hugon F. Role of molecularly imprinted polymers for selective determination of environmental pollutants-a review. Anal ChimActa2008; 622: 48-61.
- Lindsey JS, Schreiman IC, Hsu HC, Kearney PC, Marguerattaz AM.Rothemund and Adler-Longo reactions revisited: synthesis of tetraphenylporphyrins under equilibrium conditions. J Org Chem1987; 52: 827-836.
- Warner RW, Lawrence DS, Lindsey JS. An Improved Synthesis of Tetramesitylporphyrin. Tetrahedron Lett1987; 28: 3069-3070.
- Lindsey JS, Warner RW. Investigation of the synthesis of ortho-substituted tetraphenylporphyrins. J Org Chem1989; 54: 828-836.
- Tay T, Türk H, Say R. Synthesis of 5-(4-methacrylamidophenyl)-10,15,20-triphenylporphyrin, its copolymerization with acrylamide and EDMA, use of this copolymer in the adsorption of bovine serum albumin. React Function Polymer 2007; 67: 999-1007.
- Luguya R, Jaquinod L, Frank R, Grac FM, Vicente H, Smith KM. Synthesis and reactions ofmeso-(p-nitrophenyl)porphyrins. Tetrahedron 2004; 60: 2757-2763.
- Hasegawa E, Nemoto JI, Kanayama T, Tsuchida E. Syntheses and properties of vinyl monomers containing a meso-tetraphenylporphin ring and their copolymers.Europen Polymer J 1977; 14: 123-127.
- Hür D, Ekti SF, Say R. N-Acylbenzotriazole Mediated Synthesis of Some Methacrylamido Amino Acids.Lett Organic Chem2007; 4: 585-587.
- Sener G, Ozgur E, Yilmaz E, Uzun L, Say R. (2010) Quartz crystal microbalance based nanosensor for lysozyme detection with lysozyme imprinted nanoparticles. BiosensBioelectron2010; 26: 815-821.
- Karabacak RB, Tay T, Kivanç M. Preparation of novel antimicrobial polymer colloids based on (+)-usnic acid and poly(vinylbenzyl chloride). React Function Polymer 2014; 83; 7-13.
- Bouchemal K, Agnely F, Koffi A, Djabourov M, Ponchel G. What can isothermal titration microcalorimetry experiments tell us about the self-organization of surfactants into micelles? J MolRecognit2010; 23: 335-342.
- Erdem M, Yüksel E, Tay T, Cimen Y, Türk H. Synthesis of novel methacrylate based adsorbents and their sorptive properties towards p-nitrophenol from aqueous solutions. J Colloid Interface Sci2009; 333: 40-48.
- Tay T, Candan M, Erdem M, Cimen Y, Turk H.Biosorption of Cadmium Ions from Aqueous Solution Onto Non-living Lichen Ramalinafraxinea Biomass. CLEAN-Soil Air Water 2009; 37: 249-255.
